Jul 23, 2010

AEX - Elliott Wave Update

The European (Dutch) market looks bullish as well as the US one. As early as this week we'll see how strong the new rally really is. Friday performance already showed us that it doesn't seem to be the optimum. It retraced normally (healthy) at 61.8% Fibo, and as you see we are up again.
.
I've got to say that I'm not quite sure about the emerging pattern on daily base, but sure there is more room for the price to go up.

                                                                                                                     Some Dutch history
Dutch Expansion in the East IndiesImage via Wikipedia
Good luck!


Jul 22, 2010

EWI- Free week announcement

A pumpjack in TexasImage via Wikipedia
          While the Indexes make aggressive attempts for bear channel breaking, I will try to announce the EWI free week on Energy.
Where is going the petrol value?
          Our friends at Elliott Wave International have just announced the beginning of their wildly popular FreeWeek event, where they throw open the doors for you to test-drive some of their most popular premium services -- at ZERO cost to you.
You can access EWI's intraday, daily, weekly and monthly forecasts from EWI's Energy Specialty Service right now through noon Eastern time Wednesday, July 28. This service is valued at $347/month, but you can get it FREE for one week only!
The timing couldn't be better because Crude Oil and Natural Gas are both approaching important junctures. Opportunity is calling. This unique event only lasts a short time, so don't delay! Just click the on the link below or the banner above the post. 
Learn more and get instant access to EWI's FreeWeek of Energy analysis and forecasts now -- before the opportunity ends for good.
You probably ask yourself : Why does that guy announces EWI services?     Simple-  EWI will credit me 3 bucks for each free subscription-generous donation :-) Thank you!
Some fundamental news in past tense :-) Oil edges above $77 on Europe, China optimism

Jul 20, 2010

SPX 500 Elliott Wave update

 Definitely  the short term picture looks bullish, even with the weak attempt to break the channel line. Anyway, this week is going to be interesting because we've got an impulse five up, which I labeled as "A" without any important resistance overcame. A short "a,b,c" correction is expected, which perhaps will try to test the previous 07/01 low. I think the price will calm down around 1035 before the next attempt to break the upper channel line.
                                                  chart updated 21/07
Good luck trading!


Jul 15, 2010

SUGAR- Elliott Wave Update

The sugar bulls seem to be still breathing. The price tested important support and bounced up successfully for new corrective high. Most likely the price will nest at $24.56 area and then will collapse for "C" wave of a "zig-zag". There are few evidence supporting that scenario :
  • The price will meet 61.8% of "A" wave.
  • There is 161.8% of the corrective (a) wave.
  • If we overcame 38.2% will see the right shoulder of  potential H&S pattern completed, and that zone in the bigger ellipse matches with the target roughly. 
  • See the circled bar in red.
                                                            Good luck trading!
Enhanced by Zemanta

Jul 13, 2010

SP 500 ON A CROSSROAD

While the price moves on schedule I will share with you my med term point of view. Currently we are in a crossroad and I give equal % to each of all med. term scenarios below.
According to first one the price hits the upper channel line and bounces down directly for the H&S target.
On the chart below the price makes "zig-zag", breaking the channel, but stays under the 1131 resistance, and makes one more leg down testing the zone between the solid red lines, where the 161.8 % Fibo of "A" wave is. And then up again.
Here is shown dramatic 1131 resistance and trend channel penetration.The price action takes lateral truck for at least several months, and then up again for the bigger H&S target-1370.
Conclusion:
I still can't count any impulsive wave since March 2009 low till April 2010 top without breaking the EWP rules.That suppose to be a complex correction. I don't want to freak you out, but despite that, I can't agree with the Flash Crash scenario yet. My long term bias is still bullish, just need to see deeper correction of the correction completed, before resuming the road to the ridge. Next couple a days I will nail my long term point of view picture on my blog's first page. From a timing point of view the trend should still be down into March 2011. 2010 should be bearish year according to Gann as well. So let the market decide where.
Good luck trading!


Jul 6, 2010

SP 500 cash index

Down sell target was reached, that had been prognosticated in my last post. Probably a week low was marked.We got the H&S pattern. The price slides down perfectly fit between the trend lines. Even the daily indicators don't look oversold. The things look simple.  It cannot be better. Now what? We should turn upwards now. The market needs a small and weak counter trend, filling the open gap noted on the chart below. One of the confirming things we have to look for is a reversal daily candle this week. It is maybe on place. The wave count looks proportionally completed. 
One thing is for sure: If we break the trend line downwards next few days the bear smell will spread out everywhere, and the very well known EWI flash begins, and my long term huge triangle scenario for the last few months fades out. 
I would like to add the bearish expectations chart according to AAII. The bearish bias among the investors rose up to 33 % last week. This level is very close to 7/09 35.6 %, when the price takes off again.


Jul 1, 2010

EUR/USD - Buy EURO

Now I think the expected rally for the EUROPEAN UNION began. Good luck!!!


Jun 30, 2010

DAX - Elliott wave update

In 2007 I noticed DAX and other EU indexes made their high few months earlier (June,July) than their US famous brothers- October. But they bottomed in March 2009 almost together ( 3 days difference ). I'm just curious- is there any correlation to follow?  
The chart bellow promises possibilities for as I said in previous posts about DAX- wide range day to swing trading. Be prepared.

SP 500

Last week the price rebounded very impressively from the 1*1 Gann Angle downwards.The next and relatively powerful support is 1037, which was tested very timid yesterday. If this week closes underneath we would have a significant medium term sell signal, that would lead the price to the first sell target at 1000 to 1008. If we rebound next two trading days from the neckline, then could see the right shoulder, and even above-1150. All depends on the next few trading days.


Jun 20, 2010

SP 500 The bulls woke up again

       This mornings price action confirmed strong bullish signal breaking the main 1*1 Gann angle.  There are overbought conditions in four hours chart and lower time frames, so we can reckon on brief pullback, testing the 1*1 angle and potential "A"wave support . If the price refuse to break the "A" wave and 1*1 angle support  will be setup the perfect long entry again. 

Good luck!

Jun 11, 2010

DAX - Elliott wave update

I am glad to be back in the race - too busy lately. 
Probably the down swing, which began in 04/26/2010 will not last for 34 trading days but more likely for 55, will see.The daily chart below shows my primary pattern, which tends to be formed next weeks. (in my favor:-)


The chart below shows the primary labeling, which differs a little since my last update. I left the impulse five as an alt. count this time, because I am not so sure. I've got some different signals, but nothing is decided yet. It depends very much on Monday and Tuesday. The price could continue toward to 6300, but only if the battle zone between the thick red lines is overcame by the bulls. 6300 is100% of potential  A wave of a zig-zag, and [b] wave of a potential triangle. 
If the red zone resists, then we could find another previous lows (5605) test.
Have a nice weekend !

Jun 2, 2010

DAX- Elliott Wave Update

After clear five waves and 38.2% Fibo pull back against the five, usually I jump into the market. I did it yesterday being long again, chasing potential "C" or "3". 

I expect hitting the possible target (around 6215) in 11th of June 2010 due to my time calculations, based on the  Gann Theory.


May 28, 2010

DAX - Brief Elliott wave update

           To be honest, I didn't expect such a fast and sharp acceleration of yesterday's price movement. And that "corrective"  bounce up is on really serious doubt. I expect test at 5905 support and then up to 6031 resistance, where my first target is.

May 26, 2010

DAX - Possible lateral track next weeks in wide range

DAX's reaction last week was very calm comparing it to the rest of the world indexes. DAX is one of the EU indexes which can give a clue for market direction before the others. As you noticed NASDAQ100 refuses to decline as well, and bravely defends its low since 5/6/2010. That also should be a clue for the US indexes.
     I came up with a completed flat correction, where the situation offers clear day trading buy entry.
Good luck!
P.S. Today is the monthly full moon cycle. That usually makes the bulls more aggressive!

May 24, 2010

SP 500-Today is the day

           Today is the 21st trading day of the down swing and I still bet on my bullish scenario and expect important low today. As I see DJIA and NASDAQ100 don't give a support to SPX, which is divergence for me as well. At 1047 the 5th of potential "C" will be equal to 1st by length and it is favored point for reversal.

My expectations on daily chart look promise possible huge lateral track for the next few weeks.Of course the day trading will be preferred. 

May 20, 2010

Sp 500 - Are you ready to cover your shorts, just in case?

         At the beginning of the week the markets recaptured a little bit, but since Thursday they are on their way to test the 05/06/2010 lows. Further I assume that those lows are extremely significant and they should resist. Correspondingly I am quite adjusted bullish, but I know that a test of those lows is necessary to confirm the long term upward trend(potential C wave of a zig-zag, and of course new highs). 
Today a perfect low would be at 1090, when a daily price and time magnet will coincide, completing a zig-zag as 2nd wave.


May 18, 2010

AUD/CHF - Forex

Short opportunity. The pair seems to be ready for at least one more leg down. 


May 16, 2010

Gold - Elliott Wave Update - Shine Time Part II

         The Gold pulled over few more points after first target (1208) I projected in Apr/20/2010. After short break the price went to uncharted territory and marked new high. Reaching all time highs, the price action didn't show any violent counter reaction. All the setups show that gold has not reached its overriding targets yet. The daily setup puts out the important mark of 1205-1207 where gold should fall onto maximally this week, and will set up a new buy entry.
The 1205-1207 support zone seems to be very strong. That's why I think gold is on its way to another rise. Next closer target is around 1275-1280. 
 
As we see the price was stopped by the main 1*1 Gann Angle again. Next (final) test, and reaching the final 1320 target probably will be in June- little earlier than I expected in my last posts, due to the acceleration. Be prepared to buy any dip. Good luck!  


May 15, 2010

SP 500

I still favor higher prices into late July or early August. The recent decline went much further then I expected and setup the perfect long entry. One more bearish"zig-zag", and testing the previous Thursday low is  possible as well.

I tried to  apply the Fibonacci model on the daily SP 500 chart, and got some results.


I still got bullish bias about SP500 until the price action prove the opposite.

  You know .......that's life , that's what all the people say
                                    You're "buying" high in April, "short" down in May
                                    But I know I'm gonna change that tune
                                    When I'm back on top, back on top in June............................

Enjoy the weekend.


May 13, 2010

Sugar

         Probably the sugar is rolling over for upward correction. Since February 2010 top the commodity has dropped down in five completely clear waves. And they look completed for now.
         We need to see breaking the main resistance at 17.74 in five waves to have buy signal, of course after brief  test the support/resistance at 15.50.  Be prepared.

Apr 28, 2010

DAX-Elliott wave update

       Well, the picture doesn't seem as bearish as all the bears wish (short term I am bear too).
The chart below shows my primary count, which was relabeled a little. I am just trying to fit the labels to one incomplete (to me) pattern. At other hand on daily time frame the market tries to produce reversal candle from todays low (6023). One more reason, which makes me feel little confused is the full moon cycle. According to the moon calendar today 28/4/10  is the full moon. According to my 14 months research about the connection between the moon and the stock market reminds me that todays moon influence could kick off the  market (indexes) higher. That is a fact every time, when the full moon occurs .The chart's look confuses even me. Next time I promise neater charts looking.


Apr 26, 2010

DAX - Elliott wave update

  DAX didn't get support in last few days heights.STOXX50, AEX, FTSE100 etc. denied to follow their European brother. That usually means trend change or correction in the current time frame. According to the wave count (5)th wave is not complete yet. Most acceptable price level for reverse looks around 6480 level. 


Apr 20, 2010

Gold - Elliott Wave Update - Shine Time

              By the yesterdays closing price, the spot gold produced reversed candle and confirmed its $1123.60 low. That was very close to the low $1120 I expected in my last post . The resistance at $1145.80 is broken already.  
              Thus I have to prepare for the next target at $1208. 


Meantime the US indexes are ready for new high.

Apr 19, 2010

Disastrous eruptions

         Volcanic eruptions, the Goldman Sachs scandal and the Google figures – what else guys?  Which accident  is not quoted to give reasons for a sell off and to oracle the new system crash. It’s amusing to see the whole media pack panting behind thousands of reasons for tops or bottoms.
This is a new bull market, not bear market correction, this time is different- says the media…...No way..... That was really fundamental.

         The real reason is that S&P 500 reached its first preferred exhaustion target (1215) last week, causing thus a violent counter reaction. That was due to the Fibonacci sequence, Wave count ant Gann timing angles. That rise is based on the supposition that the financial markets as well as our lives, our decisions, simply our entire environment go through cycles which can be determined in advance - the same old story….

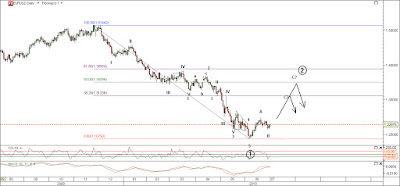
        Let's take a snapshot at EUR/USD picture. According to the current wave count the pair has made very clear five waves dip. As most of the EW followers know we need to reckon on corrective pull back, testing one or few of the main Fibonacci levels on the chart below.
       Again,  the EURO guess takes off for a while. What will the fundamentals say about this? Due to the disastrous picture? What's the sense?


Apr 16, 2010

SPX - Is this a bull market?

The short answer is YES. The bull market is a fact. Fact is also that I can't count any five wave impulse up since 03/06/09 without breaking the main Elliott Wave Principle Rules.
 I would like to focus on the topic which course the American stock market is going to adopt and to concentrate upon the price target, which is expected in April. 
The chart below shows one of my both wave counts and potential short term price and time targets.
Next chart below is the alternative one, where I relabeled few highs and lows. But however, the mid wave count  doesn't matter in this case, more important is the pattern 


AAII Sentiment Survey gives support to my short term bearish bias. 
This week's survey saw bullish sentiment rise to 48.5%, below its long-term average of 38.9%. 
Short term Average:
Bullish 48.5%
up 5.6

Neutral 21.8%
down 5
Bearish 29.7%
dow
Long-Term Average:
                                                                  Bullish: 39%
                                                                  Neutral: 31%
                                                                  Bearish: 30%
Check this out -mega extreme indicator (Put/Call Ratio)levels