Apr 20, 2010

Gold - Elliott Wave Update - Shine Time

              By the yesterdays closing price, the spot gold produced reversed candle and confirmed its $1123.60 low. That was very close to the low $1120 I expected in my last post . The resistance at $1145.80 is broken already.  
              Thus I have to prepare for the next target at $1208. 


Meantime the US indexes are ready for new high.

Apr 19, 2010

Disastrous eruptions

         Volcanic eruptions, the Goldman Sachs scandal and the Google figures – what else guys?  Which accident  is not quoted to give reasons for a sell off and to oracle the new system crash. It’s amusing to see the whole media pack panting behind thousands of reasons for tops or bottoms.
This is a new bull market, not bear market correction, this time is different- says the media…...No way..... That was really fundamental.

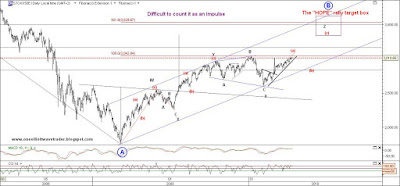
         The real reason is that S&P 500 reached its first preferred exhaustion target (1215) last week, causing thus a violent counter reaction. That was due to the Fibonacci sequence, Wave count ant Gann timing angles. That rise is based on the supposition that the financial markets as well as our lives, our decisions, simply our entire environment go through cycles which can be determined in advance - the same old story….

        Let's take a snapshot at EUR/USD picture. According to the current wave count the pair has made very clear five waves dip. As most of the EW followers know we need to reckon on corrective pull back, testing one or few of the main Fibonacci levels on the chart below.
       Again,  the EURO guess takes off for a while. What will the fundamentals say about this? Due to the disastrous picture? What's the sense?


Apr 16, 2010

SPX - Is this a bull market?

The short answer is YES. The bull market is a fact. Fact is also that I can't count any five wave impulse up since 03/06/09 without breaking the main Elliott Wave Principle Rules.
 I would like to focus on the topic which course the American stock market is going to adopt and to concentrate upon the price target, which is expected in April. 
The chart below shows one of my both wave counts and potential short term price and time targets.
Next chart below is the alternative one, where I relabeled few highs and lows. But however, the mid wave count  doesn't matter in this case, more important is the pattern 


AAII Sentiment Survey gives support to my short term bearish bias. 
This week's survey saw bullish sentiment rise to 48.5%, below its long-term average of 38.9%. 
Short term Average:
Bullish 48.5%
up 5.6

Neutral 21.8%
down 5
Bearish 29.7%
dow
Long-Term Average:
                                                                  Bullish: 39%
                                                                  Neutral: 31%
                                                                  Bearish: 30%
Check this out -mega extreme indicator (Put/Call Ratio)levels


Apr 15, 2010

S&P 500

My short term bearish bias is getting extreme. Target  around 1243-based on the current count. If not correct- max 1215. 


Later I will put on air daily SPX chart.

STOXX 50

                           STOXX50I is already in the targetzone of it's H&S target.

 In the last update I counted 5 waves down and supposed brief upward correction, and down again. Unfortunately it was really "five", but "C" wave of an "expanded flat".  You know......, the market is always right and never likes to make the things easy for anyone. I was in the trap as well, but smell it earlier and covered my short without profit.