Showing posts with label SP 500. Show all posts

Sep 3, 2010

SP 500 Elliott Wave Update - Weekly chart

          Dead cat bounce or resuming the Bull trend? 
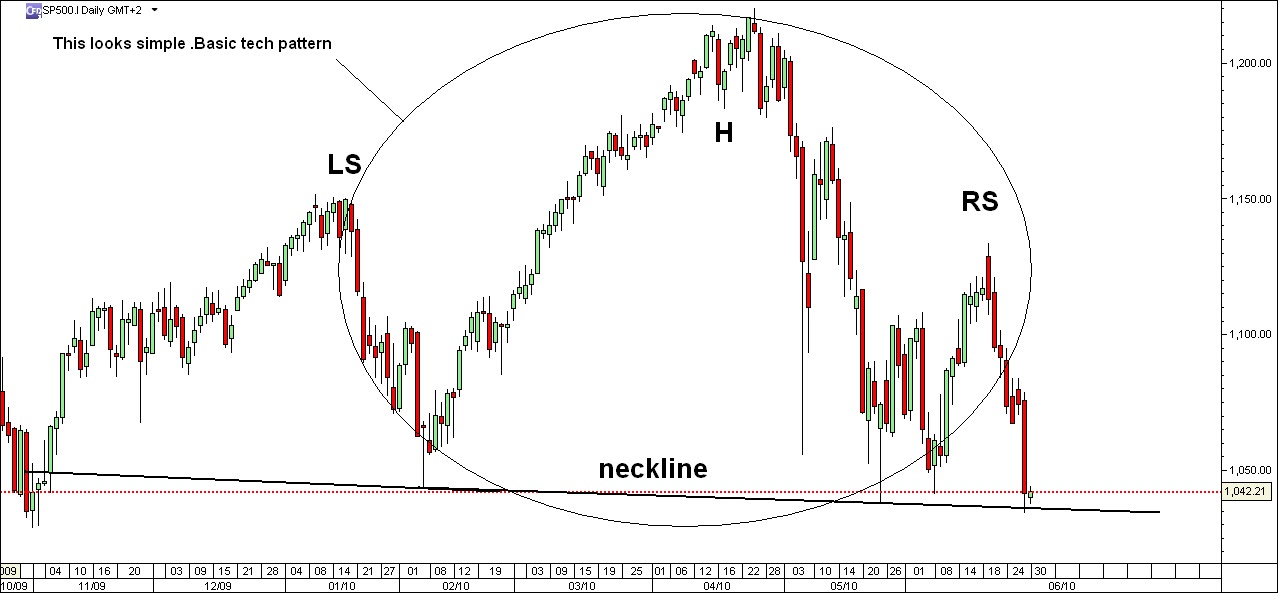
That is the main question, that really confuses bulls and bears now. What about the big H&S pattern? Yeah... I've seen many fake ones.
          In one of the SP 500 updates I mentioned, that 1007 is great support zone. And it's not broken so far. 
          The market is just bouncing above the 1*2 Gann Angle (trend line now) that will be close shave to overcome. Lately I am working on the assumption that July's low(1007) has marked the end of the corection as Primary B wave. I also have adopted the idea of large "flat" or "triangle"' who's (a) Intermediate met the 1007 support, and now is forming "C" Minor of (b) Intermediate and so on..
           But the bounce is still limited by the bear trend line and 1100-1103 resistance. I think this week's candle will not make it. So better cover the longs for the weekend and aim again next week.


Aug 24, 2010

SP 500 -Elliott Wave update

       Last few weeks/moths the Us indexes offered a lot of mixed signals and counts, which divided the EW blogosphere into three groups:  bullish, bearish and neutral (including me). I changed my count slightly about S&P, giving a little bullish tune in the whole scenario, at least for the next couple of days or weeks. According to the DIS (Daily Index Sentiment) the US indexes have momentum and volume driven models, that appear to be preparing to switch to Buy signals with proper positive action today or in tomorrow's session. My indicators in 4 hour chart show oversold conditions, giving a clue for rebound as well. But as I've said many times: trading overbought or oversold market only, without stronger confirmation is really looking for trouble. 
       The chart below  shows the count I prefer, and the important short term resistance (1099.86), which once broken will prove my count.
Today's candle lays exactly on a time line, which might mark a low today. The price currently is very close to the support/resistance zone,  which once broken, will confirm the bearish case.
P.S. According to moon calendar today occurs  the full moon cycle, which usually makes bulls crazy and fearless.
Good luck trading!

Aug 12, 2010

SP 500 - "Y" wave might began

          Despite my expectations for higher levels the bigger pattern "W,X,Y" still remains valid, just one more stop hit, refreshing my face. So, I just have to kick myself back in the race. 
        This time I come up with a candlestick count, which perfectly fits the Fibonacci Sequence numbers as tops and bottoms, taking the top, made in 4/26/2010. I have included a charting tool as well, which helps me to determine support/resistance levels and potential target zones. That tool is made, based on Fibonacci and Gann calculations. Now I am testing it. If it works properly  I will continue to use it, combined with wave count.


Aug 4, 2010

CFD SP500 - One more bullish weekly signal

We have one more strong buy signal on weekly base, given by the MACD(circled in red) . I've noticed that the big shots open their thick wallets  in such cases as well.  
The price currently is licking the upper channel line, but it's still in.
The calculated short term target on daily base becomes more real in case we break the channel upward and close above it. Short break around 1138 could accumulate little more buying power.
 Strategy: Buy.
           Cover at 1150.
Stop at 1085 if something went wrong.
Good luck!


Aug 2, 2010

SP 500

I calculated new price target for SPX cash index. That 1149 target responds to 90 degree Gann angle. 1010,91 is taken as low point.  The calculation is based on my Square of Nine calculator. We need to overcome 1131.23 first, where the 45 degree is. I think it won't be a problem for the bulls.
                                                        

Jul 25, 2010

SP500 - 1130 is obvious

The bullish tune last week wasn't surprise at all. Sometimes trading is easy, such as it was last week. This week shouldn't be surprising either. Fridays session produced strong buy weekly candle.


Next target will be the 1131 resistance where the price is going to make very important decision about the path for the next few months: to resume the long term trend or to fall into down swing. If we break 1131.23 could pick up the 1148 high, where the left shoulder's resistance is.

                                  According to the current count the "C" leg or 3th wave is still missing. 
Good luck!


Jul 20, 2010

SPX 500 Elliott Wave update

 Definitely  the short term picture looks bullish, even with the weak attempt to break the channel line. Anyway, this week is going to be interesting because we've got an impulse five up, which I labeled as "A" without any important resistance overcame. A short "a,b,c" correction is expected, which perhaps will try to test the previous 07/01 low. I think the price will calm down around 1035 before the next attempt to break the upper channel line.
                                                  chart updated 21/07
Good luck trading!


Jul 13, 2010

SP 500 ON A CROSSROAD

While the price moves on schedule I will share with you my med term point of view. Currently we are in a crossroad and I give equal % to each of all med. term scenarios below.
According to first one the price hits the upper channel line and bounces down directly for the H&S target.
On the chart below the price makes "zig-zag", breaking the channel, but stays under the 1131 resistance, and makes one more leg down testing the zone between the solid red lines, where the 161.8 % Fibo of "A" wave is. And then up again.
Here is shown dramatic 1131 resistance and trend channel penetration.The price action takes lateral truck for at least several months, and then up again for the bigger H&S target-1370.
Conclusion:
I still can't count any impulsive wave since March 2009 low till April 2010 top without breaking the EWP rules.That suppose to be a complex correction. I don't want to freak you out, but despite that, I can't agree with the Flash Crash scenario yet. My long term bias is still bullish, just need to see deeper correction of the correction completed, before resuming the road to the ridge. Next couple a days I will nail my long term point of view picture on my blog's first page. From a timing point of view the trend should still be down into March 2011. 2010 should be bearish year according to Gann as well. So let the market decide where.
Good luck trading!


Jul 6, 2010

SP 500 cash index

Down sell target was reached, that had been prognosticated in my last post. Probably a week low was marked.We got the H&S pattern. The price slides down perfectly fit between the trend lines. Even the daily indicators don't look oversold. The things look simple.  It cannot be better. Now what? We should turn upwards now. The market needs a small and weak counter trend, filling the open gap noted on the chart below. One of the confirming things we have to look for is a reversal daily candle this week. It is maybe on place. The wave count looks proportionally completed. 
One thing is for sure: If we break the trend line downwards next few days the bear smell will spread out everywhere, and the very well known EWI flash begins, and my long term huge triangle scenario for the last few months fades out. 
I would like to add the bearish expectations chart according to AAII. The bearish bias among the investors rose up to 33 % last week. This level is very close to 7/09 35.6 %, when the price takes off again.


Jun 30, 2010

SP 500

Last week the price rebounded very impressively from the 1*1 Gann Angle downwards.The next and relatively powerful support is 1037, which was tested very timid yesterday. If this week closes underneath we would have a significant medium term sell signal, that would lead the price to the first sell target at 1000 to 1008. If we rebound next two trading days from the neckline, then could see the right shoulder, and even above-1150. All depends on the next few trading days.


Jun 20, 2010

SP 500 The bulls woke up again

       This mornings price action confirmed strong bullish signal breaking the main 1*1 Gann angle.  There are overbought conditions in four hours chart and lower time frames, so we can reckon on brief pullback, testing the 1*1 angle and potential "A"wave support . If the price refuse to break the "A" wave and 1*1 angle support  will be setup the perfect long entry again. 

Good luck!

May 24, 2010

SP 500-Today is the day

           Today is the 21st trading day of the down swing and I still bet on my bullish scenario and expect important low today. As I see DJIA and NASDAQ100 don't give a support to SPX, which is divergence for me as well. At 1047 the 5th of potential "C" will be equal to 1st by length and it is favored point for reversal.

My expectations on daily chart look promise possible huge lateral track for the next few weeks.Of course the day trading will be preferred. 

May 20, 2010

Sp 500 - Are you ready to cover your shorts, just in case?

         At the beginning of the week the markets recaptured a little bit, but since Thursday they are on their way to test the 05/06/2010 lows. Further I assume that those lows are extremely significant and they should resist. Correspondingly I am quite adjusted bullish, but I know that a test of those lows is necessary to confirm the long term upward trend(potential C wave of a zig-zag, and of course new highs). 
Today a perfect low would be at 1090, when a daily price and time magnet will coincide, completing a zig-zag as 2nd wave.


May 15, 2010

SP 500

I still favor higher prices into late July or early August. The recent decline went much further then I expected and setup the perfect long entry. One more bearish"zig-zag", and testing the previous Thursday low is  possible as well.

I tried to  apply the Fibonacci model on the daily SP 500 chart, and got some results.


I still got bullish bias about SP500 until the price action prove the opposite.

  You know .......that's life , that's what all the people say
                                    You're "buying" high in April, "short" down in May
                                    But I know I'm gonna change that tune
                                    When I'm back on top, back on top in June............................

Enjoy the weekend.


Apr 16, 2010

SPX - Is this a bull market?

The short answer is YES. The bull market is a fact. Fact is also that I can't count any five wave impulse up since 03/06/09 without breaking the main Elliott Wave Principle Rules.
 I would like to focus on the topic which course the American stock market is going to adopt and to concentrate upon the price target, which is expected in April. 
The chart below shows one of my both wave counts and potential short term price and time targets.
Next chart below is the alternative one, where I relabeled few highs and lows. But however, the mid wave count  doesn't matter in this case, more important is the pattern 


AAII Sentiment Survey gives support to my short term bearish bias. 
This week's survey saw bullish sentiment rise to 48.5%, below its long-term average of 38.9%. 
Short term Average:
Bullish 48.5%
up 5.6

Neutral 21.8%
down 5
Bearish 29.7%
dow
Long-Term Average:
                                                                  Bullish: 39%
                                                                  Neutral: 31%
                                                                  Bearish: 30%
Check this out -mega extreme indicator (Put/Call Ratio)levels


Apr 15, 2010

S&P 500

My short term bearish bias is getting extreme. Target  around 1243-based on the current count. If not correct- max 1215. 


Later I will put on air daily SPX chart.

Apr 8, 2010

S&P 500 Timid trend line breaking

According to my EW count there are five impulse waves already completed.


Apr 6, 2010

S&P 500 Final Rally

Here we go again "hungry for the market" after brief holiday(s).
 The market action is on the way to complete the last of the last wave 5 of the (a) wave of the potential "zig-zag". The time gap for the first obvious target is going to close next week probably. Possible targets 1200 or 1215 max - and then down for (b) wave.