(some thoughts about time cycles)
The most frequently asked question for every market analyst and trader is “WHEN?”
I think most of you have heard about the great 13 century mathematician Leonardo Fibonacci from Pisa (Italy). He has rediscovered the well forgotten Egyptian sequence of numbers - 1,1,2,3,5,8,13,21,34,55,89,144, and so on to infinity, called Fibonacci sequence.
Exploring the Fibonacci Sequence, I see that this is not only numerology. I am impressed that the wave spans can be fitted to these numbers with remarkable accuracy. These numbers can serve to give the analyst the opportunity to indicate possible times and levels for a market turns, especially if they coincide with price targets and wave counts.
There is no sure way of using the time factor by itself in market forecasting. Elliott has told that the time factor often conforms to the pattern, for instance with regard to trend channels, therefore it is so significant. Frequently, however durations and time relationships themselves reflect to Fibonacci measurements.
Let’s see these numbers in action. The progression of years from 1929 top about DJIA produces a remarkable Fibonacci sequence as well:
1. 1929+3years = 1932 bear market bottom
2. 1929+5years = 1934 correction bottom
3. 1929+8years = 1937 bull market top
4. 1929+13years = 1942 bull market correction bottom and so on.
I think the situation nowadays is similar to 1929.
A similar series has begun in 2007. Then DJIA and most of the major indexes made their all time highs. Thus I could see some interesting possibilities with respect to DJIA in near future. However, let’s take 2007 high as the majorpoint, and add some numbers:
1. 2007 top+1year = 2008 bear market reaction high as second wave
2. 2007+2years = 2009 bear market bottom
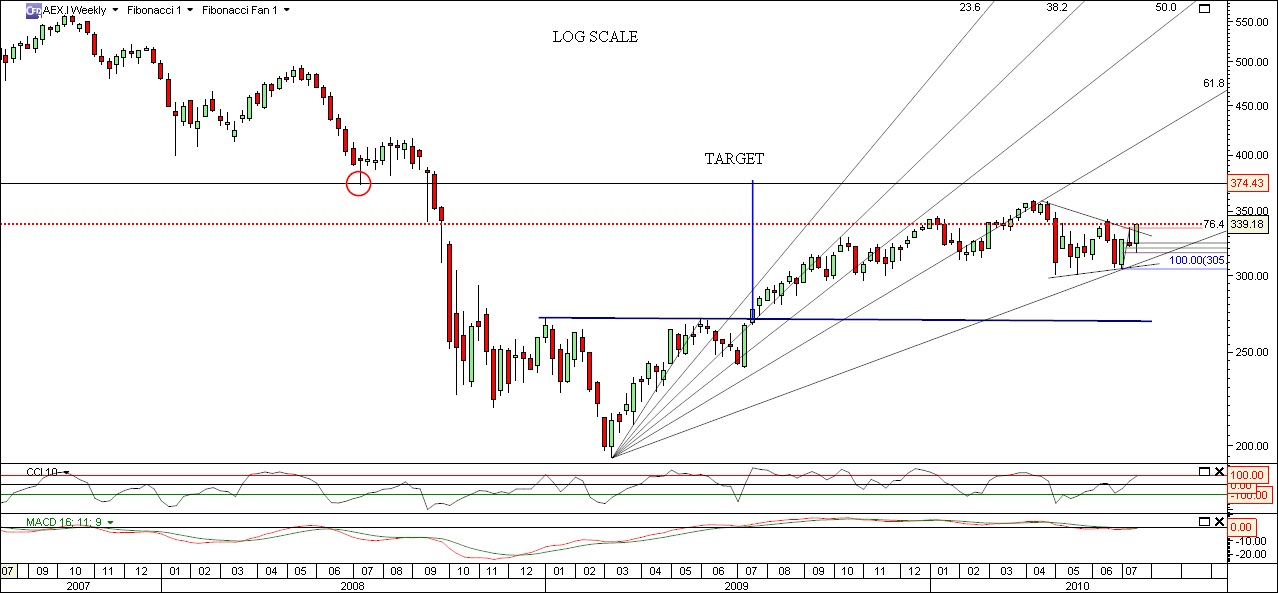
3. 2007+3years = 2010 possible top
4. 2007+5years = 2012 ???
Now I would like to mention W.D.Gann. He’s been one of the greatest traders and mathematicians in 20th century. He has made 50 millions in 50s , which is equivalent to 50 billions in nowadays.
I will take a very surface look at his rules, because they are very complicated (to me).The time factor is one of the most important things in his works. According to him every movement in the market is the result of the natural law and a cause, which exists long before the effect takes place, and can be determined years in advance. The future is a bit repetition of the past. Everything moves in a cycles as a result of a natural law of action and reaction. He also has described few major and few minor cycles. Studding the past we can discover what cycle will repeat in the future.
Sounds simple, ah?
He has also put specific market behavior behind each year’s number. The interesting is that every 10th year is a “BEAR year “according to him.
One of the cycles, which I paid attention to, is the 10 year cycle. According to Gann this cycle is one of the most important, which is the half of the 20 years cycle and 1/6 of the 60 year cycle. An extreme high or low occurs every 10 years. Important is a 7 year cycle as well.
Let’s fit some cycles:
1. 2010 should be a “bear year” according to Gann
2. Let’s take 2000 year as a major top point plus 10 years- makes 2010.
3. In 2003 the market made bottom- plus 7 years makes 2010
Do you think all that is a coincidence ? ….I do not.
It is provable by the Elliott Wave Principle as well. In terms of time, we can use wave structure for guidance. Note, that time factor is not as well incorporated into EWP as distance, so while we come up with tight time ranges, the confidence in them is less than with the target distance range.
Some more matches , based on the Golden Ratio

So, I still can claim that rally as a bear market correction, and the reversal point is very close. Question of time. There is nothing new under the Sun.


