Dec 25, 2010
SP 500
May this Christmas be so special that you never ever feel lonely and be surrounded by loved ones throughout. May this Christmas be bright and cheerful and may the New Year begin on a prosperous note. Merry Christmas!
Dec 22, 2010
STOXX 50
Since the last update about STOXX 50 I changed my expectations generally. Since March 2009 I was counting it as a bullish correction. Now the situation seems to me different.

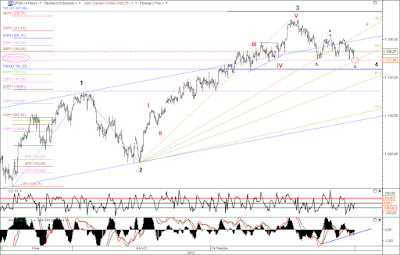
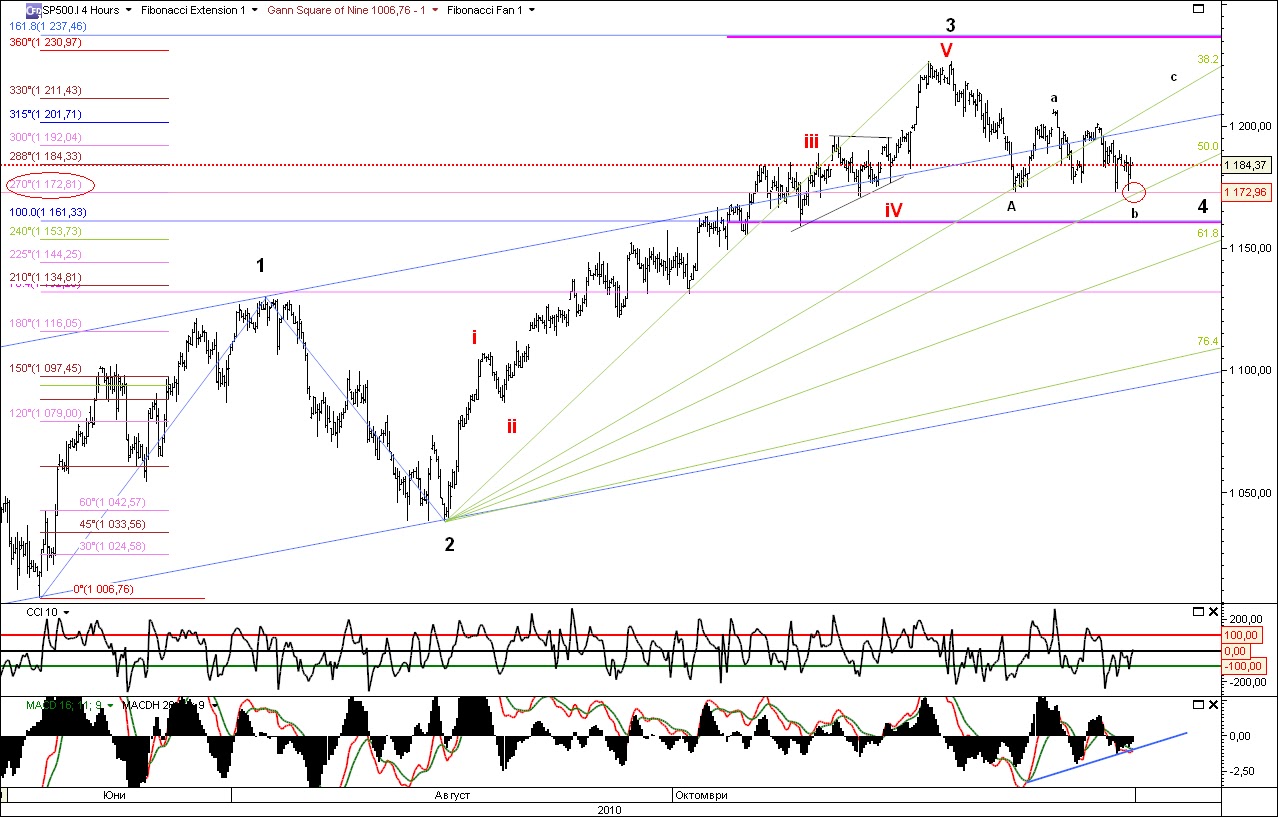
The index has declined 61.49% since 6/20/2007 to 3/09/2009. According to the Elliott Wave Principle this is very close to the deepest and important Fibonacci level(61.8)%, required for second wave retrace. Then 3 waves up until 2/11/2010, and then almost one year lateral track, probably accumulating the power for the 3th Primary wave.
I've labeled the sideways structure as completed complex correction, finished in 8/25/2010. And then first Minor wave contains five overlapping waves, and forms typical leading diagonal. This pattern occurs usually in first of the third wave.
The structure in four hours bars look impulsive as well, and we have five impulsive waves up, and 3 waves against the leading diagonal.

Next resistance is 2902,39. Support 2632,89.
Most likely we are in the 3th Minor of the (1)st Intermediate of the 3th Primary. Most likely we are in long term bull market.
Next short term terget occurs 2982,48. Then 3197,48.
Good luck trading
Dec 15, 2010
SP 500 Update
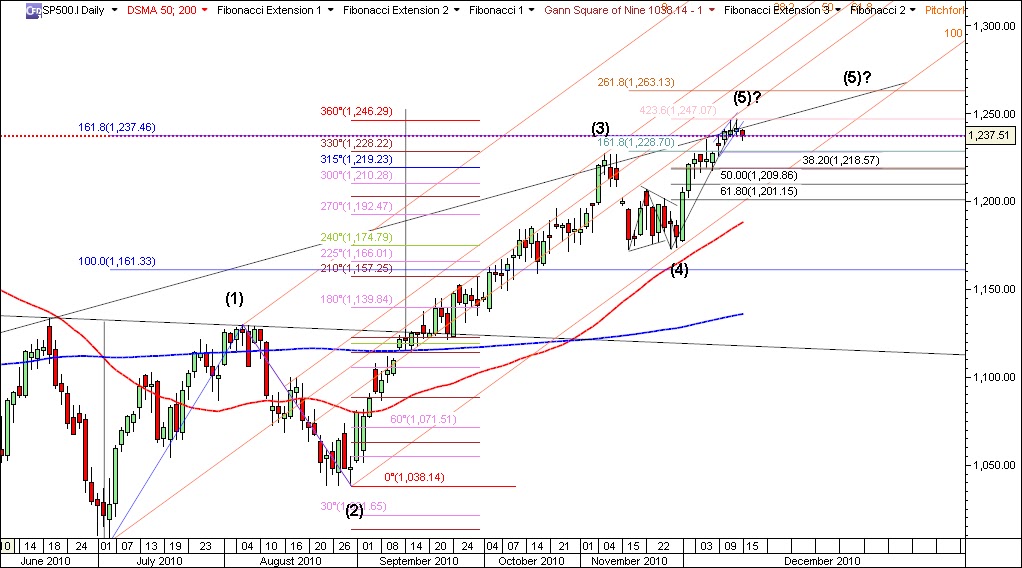
The correction might begun during the yesterdays session. I still think, that we are in 1st minor of (5)th Intermadiate and wait for more significant pullback to label correct.
There is one main question: how deep will be the pullback? The well spreaded "flash crash" or just one step back, before the next two steps ahead, which is typical for the bull market.
4 hour to daily charts show overbought and diverging conditions.
The current pullback's depth will be very important for the market to show us HIS choise:
to resume the uptrend, unfolding 2,3,4,5 of (5)th wave short to med term, or deeper retrace beyond 1173?

Next support down is the previous top 1226.78. If broken 1219.74 April top and 38.2 Fibonacci level of the current 1st wave is the next support.
Upwards 1246.75 and 1263.15.
Daily close above 1247 will be important buy signal from the current point.
Good luck trading!
Dec 9, 2010
SP 500
Short term is expected 25-30 points pullback.
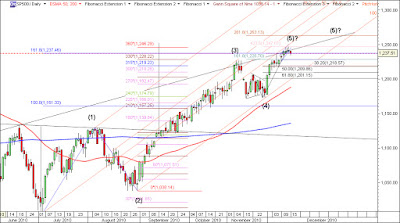
The night session registered new year short term top at 1236,97 and probably marks 1st minor of (5)th Intermadiate. This Elliott wave count appears on one very short term only. The five wave structure looks completed and wave 2 minor is underway.


The night session registered new year short term top at 1236,97 and probably marks 1st minor of (5)th Intermadiate. This Elliott wave count appears on one very short term only. The five wave structure looks completed and wave 2 minor is underway.

Medium term - the bulls control the situation and there is more room upwards for the price to go. After brief few days pullback the Santa rally will resume. The next price magnet and important Gann angle influence apears to be 1279 in the second half of January 2011, where the (5) intermediate will be completed.

Good luck trading!
Dec 8, 2010
DAX
Yesterdays session marked the pick of "i" of 5th wave. The expected pullback won't be deeper than 6760 probably.

Good luck trading!
Nov 30, 2010
SPX 500
I've got a reason to consider wave A minor of a potential triangle completed.

1 173 became strong support. Once broken the price will meet next support at 1 154.

Nov 25, 2010
SP 500
Hey Wavers, It's been difficult lately...., I know...Between the Flash Crash and believing in the real evidence-long term.
I was lucky and happy to nail the 2007-2009 slide. It will be a good story for my grand children.
I know ....we know ...it was very fast and profitable.
What is the essentials of the EWP?...1-2-3-4-5..... a-b-c? THEN 1-2-3-4-5.... and a-b-c again.
Do you know that SP500 has retraced more than 50% since the top in 2007 till March 2009.
....Probably This is the old Bull Market.
Nowadays ...
It will be very difficult for the bears to continue the pullback, and reach 1172 again after todays ignition.
Breaking 1195 downside was a good sign, that I was wrong about my latest count. Wave four Minor is the better suggestion for the current scenario. It hasn't retraced 38.2% but it can be valid as well. I like the triangle idea, but it needs little more time to unfold.

Nov 11, 2010
SPX - Cash Index
More than 2 months the bulls control the ball, slightly tired, but still in the game. Yesterday's pullback produced green bullish candlestick with not so high reliability.
Probably 4 minor wave is forming now. Minor 4th wave is particular wave pattern, and needs it's time. We got only 3 days after toping 3th minor. That's why the correction doesn't look finished yet. I have to relabel in case the price bounce up for new high today or tomorrow.
Possible test level- 1195
Target- 1237

Good luck!
Nov 9, 2010
DAX - Elliott Wave Update
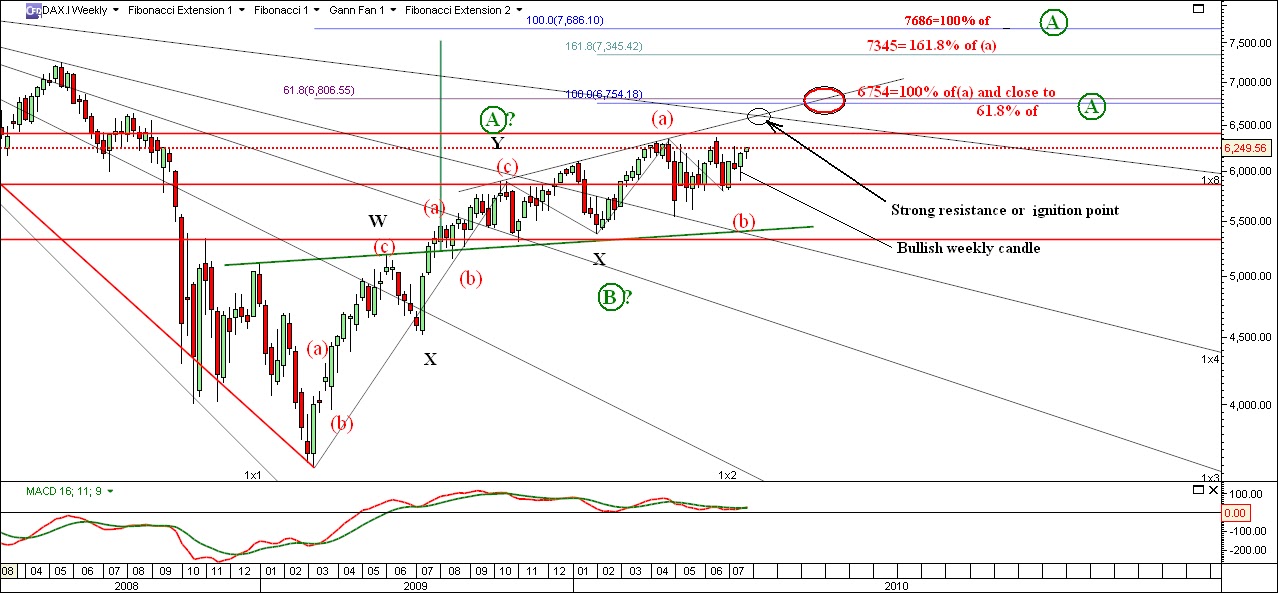
In Friday DAX closed within the target (6754), that I offered in my post in the late July.
Very interesting lines crossing has occurred when conecting few tops and bottoms, whose spot is going to be next few days. Usually around such spots the price turns.
According to the current count (4)th and(5)th waves are still expected. Probably the (3)th wave is not finished yet. Don't reckon on sell off, becuse the lowest "alowed" price level acording to the scenario is 6550. The long term trend is up, and shorting the market on daily base is risky and no preferable. Lower time frames will be suitable for daytrading.

Good luck!
Nov 2, 2010
GOLD Elliott Wave Update
People will say that all greed in the world has bought gold, and continues buying it, like in "The gold rush".
The gold rush during the 3th waves looks like madness spread among the people. No one cares about falling prices, and they are right, we are in the "gold (3)th rush". A friend of mine asked me about market correlation between spot gold and US Indexes. I really, really don't look for correlation between Gold and other markets and I really don't care about correlations, because my observations are that market correlation occurs from time to time, and it's no reliable to analyse and trade, using such a method. Everything is math.
The last months bouncing price wasn't surprise. Currently I don't trade precious metals, just like to analyse it long term, from time to time.
I can only say : buy any dip. Enjoy the chart.
Good luck!!!

Oct 24, 2010
SP 500 - Bear balls on fire
Last 8 weeks SP500 rose slowly and steadily. Currently I don't expect


deeper retrace before hitting the 1235 new high. Yes higher prices. It is also 161.8% Fibonacci of i or A wave.
Since 1007 low the market has risen 5 weeks as initial impulse, then 3 weeks corrected. After the 1038 support we have 8 up- all Fibonacci numbers. 5+3+8=16. Next number in the sequence is 21. So if we can reckon on that count need at lest 5 more weeks to extend, which makes the week 11/22 -11/28/2010.

Good luck!
Oct 15, 2010
AEX- Elliott wave update
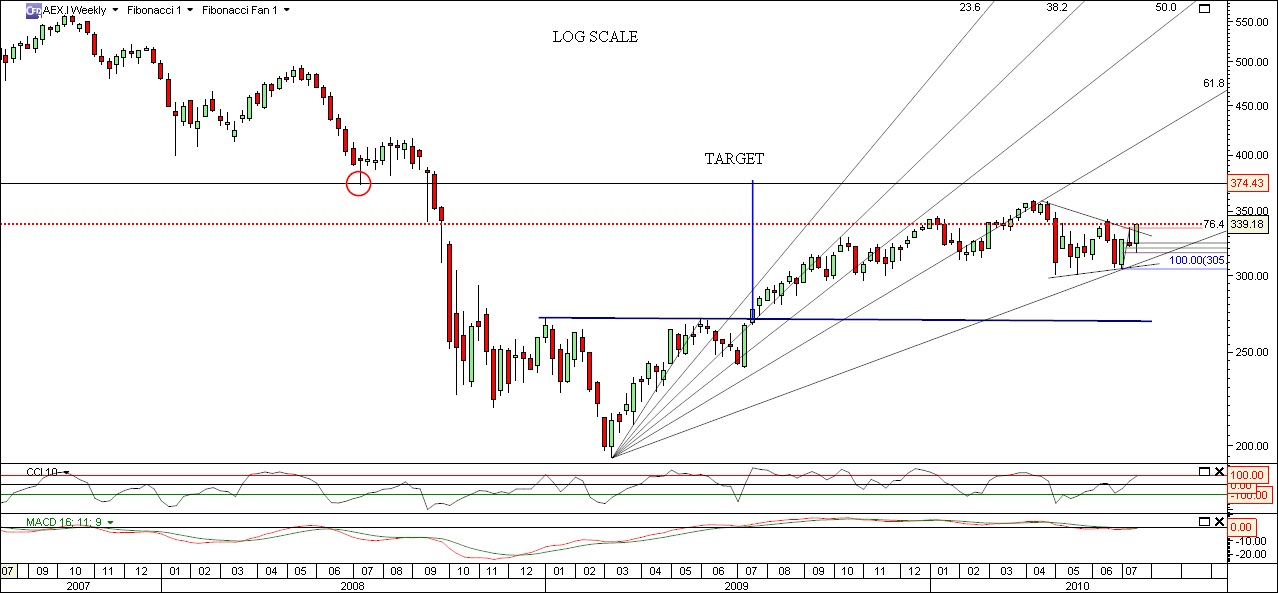
AEX is one of my favourite European Indexes. Since May the price chose the wide range lateral track. Technicaly the price is still in that lateral track channel, where bulls and bears are still regrouping. Whose group is going to take advanse; we"ll make us clear later this year. According to the current Elliott count we must be in the game already, because the iii of a (3) or (c) is in progress. And bigger pattern "flat" has already finished, marking (c) wave(305.17) as main low. The projection of the next leg up is at least to 61.8% Fibo of " i " wave- around 350.


My favourite charting tool shows the same target as well.

Good luck!
Oct 4, 2010
GOLD Elliott Wave Update
Since the last update on Gold I relabeled the waves, but the direction stays the same. Currently there's nothing that points change of the main trend. Friday was the 47 th day of the beginning of the 3th wave, so we can expect at least eight more days rally, and will not see any dramatic trend change. Even in case of a very sharp correction on daily basis we will be able to go long again and buy the dip.

Sep 20, 2010
SP 500
Despite the ongoing weakness in the real economy, last week was very good and positive for most of the world indexes.
As I said in few posts ago I am working on the assumption that the main (bullish) trend resumes and the correction (1006 low in 7/6/2010) marked the "B" Primary wave in my count. There is a small possibility for deeper retrace into 50.0% of the entire move up since March 2009, but it's too early to think and talk about it. Now we are chasing the pointed 1170 target.

As I said in few posts ago I am working on the assumption that the main (bullish) trend resumes and the correction (1006 low in 7/6/2010) marked the "B" Primary wave in my count. There is a small possibility for deeper retrace into 50.0% of the entire move up since March 2009, but it's too early to think and talk about it. Now we are chasing the pointed 1170 target.

Sep 13, 2010
DAX -Elliott Wave Update
Very interesting and rising wedge looking pattern is forming on daily and weekly base. My first look defined that pattern as trend reversal, but the the whole formation's wave structure put some bullish tune.
Last week closed exactly below 6213, relatively near the week high (6235). After the positive week the market opened higher in Monday as I expected. First possible target matches with 6420 price. It's worth to be long now.


Last week closed exactly below 6213, relatively near the week high (6235). After the positive week the market opened higher in Monday as I expected. First possible target matches with 6420 price. It's worth to be long now.

The wave structure on daily and 4 hour base defines that pattern as nothing more than bullish "running flat" for now. The plunge above the current resistance levels is expected in September.

Good luck trading!
Sep 12, 2010
Sep 7, 2010
SPX 500 Very short term - wait and aim.
Impulsive 3th or just an ordinary C of "zig-zag", It definitely worths to get in (long). But maybe later this week or next one-when the pull back is done. Around 1073.


Good luck trading!
Sep 5, 2010
EWI- Free week announcement
Subject: It's FreeWeek at EWI: Get charts, analysis and forecasts of Asian-Pacific and European markets
Greetings,
Our friends at Elliott Wave International have just announced the beginning of their wildly popular FreeWeek event, where they throw open the doors for non-subscribers to test-drive some of their most popular premium services -- at ZERO cost to you.
You can access EWI's near-term analysis of Asian-Pacific and European markets from EWI's Short Term Update services (combined valued at $98/month) right now through noon Eastern time Friday, Sept. 10.
The timing couldn't be better. Editor Chris Carolan has been on top of the recent market action in Asian-Pacific and European markets. This unique event only lasts a short time, so don't delay!
Sep 3, 2010
SP 500 Elliott Wave Update - Weekly chart
Dead cat bounce or resuming the Bull trend?
That is the main question, that really confuses bulls and bears now. What about the big H&S pattern? Yeah... I've seen many fake ones.
In one of the SP 500 updates I mentioned, that 1007 is great support zone. And it's not broken so far.
The market is just bouncing above the 1*2 Gann Angle (trend line now) that will be close shave to overcome. Lately I am working on the assumption that July's low(1007) has marked the end of the corection as Primary B wave. I also have adopted the idea of large "flat" or "triangle"' who's (a) Intermediate met the 1007 support, and now is forming "C" Minor of (b) Intermediate and so on..
But the bounce is still limited by the bear trend line and 1100-1103 resistance. I think this week's candle will not make it. So better cover the longs for the weekend and aim again next week.

Aug 24, 2010
SP 500 -Elliott Wave update
Last few weeks/moths the Us indexes offered a lot of mixed signals and counts, which divided the EW blogosphere into three groups: bullish, bearish and neutral (including me). I changed my count slightly about S&P, giving a little bullish tune in the whole scenario, at least for the next couple of days or weeks. According to the DIS (Daily Index Sentiment) the US indexes have momentum and volume driven models, that appear to be preparing to switch to Buy signals with proper positive action today or in tomorrow's session. My indicators in 4 hour chart show oversold conditions, giving a clue for rebound as well. But as I've said many times: trading overbought or oversold market only, without stronger confirmation is really looking for trouble.
The chart below shows the count I prefer, and the important short term resistance (1099.86), which once broken will prove my count.


The chart below shows the count I prefer, and the important short term resistance (1099.86), which once broken will prove my count.

Today's candle lays exactly on a time line, which might mark a low today. The price currently is very close to the support/resistance zone, which once broken, will confirm the bearish case.

P.S. According to moon calendar today occurs the full moon cycle, which usually makes bulls crazy and fearless.
Good luck trading!
Aug 18, 2010
DJIA - Elliott Wave update
The corrections usually are the most boring part of the trading.

I am calling that FIGANNELL update, because it's all in.
Aug 15, 2010


Aug 13, 2010
SUGAR- Elliott Wave Update- Friday the 13th
No surprises here. The entire corrective rally started in 5/7/2010 still continues. Since my last update the price action painted H&S pattern as I expected.


Aug 12, 2010
SP 500 - "Y" wave might began
Despite my expectations for higher levels the bigger pattern "W,X,Y" still remains valid, just one more stop hit, refreshing my face. So, I just have to kick myself back in the race.
This time I come up with a candlestick count, which perfectly fits the Fibonacci Sequence numbers as tops and bottoms, taking the top, made in 4/26/2010. I have included a charting tool as well, which helps me to determine support/resistance levels and potential target zones. That tool is made, based on Fibonacci and Gann calculations. Now I am testing it. If it works properly I will continue to use it, combined with wave count.


This time I come up with a candlestick count, which perfectly fits the Fibonacci Sequence numbers as tops and bottoms, taking the top, made in 4/26/2010. I have included a charting tool as well, which helps me to determine support/resistance levels and potential target zones. That tool is made, based on Fibonacci and Gann calculations. Now I am testing it. If it works properly I will continue to use it, combined with wave count.

Aug 4, 2010
CFD SP500 - One more bullish weekly signal
We have one more strong buy signal on weekly base, given by the MACD(circled in red) . I've noticed that the big shots open their thick wallets in such cases as well.
The price currently is licking the upper channel line, but it's still in.

The calculated short term target on daily base becomes more real in case we break the channel upward and close above it. Short break around 1138 could accumulate little more buying power.

Cover at 1150.
Stop at 1085 if something went wrong.
Good luck!
Aug 2, 2010
SP 500
I calculated new price target for SPX cash index. That 1149 target responds to 90 degree Gann angle. 1010,91 is taken as low point. The calculation is based on my Square of Nine calculator. We need to overcome 1131.23 first, where the 45 degree is. I think it won't be a problem for the bulls.

Jul 27, 2010
DAX - 6352-Down behind my shoulder
In my last update about DAX I was expecting "expanded flat". The "flat occurred, but the"running"one-A,B,C. It's not a secret that I am deadly bullish on daily to weekly base about some EU indexes including DAX, but expected little different pattern (expanded flat).
As usual the market loves to make us look stupid- often. I still support my bullish bias, due to the strong daily and weekly signals. There is not much text to add to the current count. I reckon on small and brief pull back next one-two days to get the "long" path again.


As usual the market loves to make us look stupid- often. I still support my bullish bias, due to the strong daily and weekly signals. There is not much text to add to the current count. I reckon on small and brief pull back next one-two days to get the "long" path again.

Good luck!
Jul 25, 2010
SP500 - 1130 is obvious
The bullish tune last week wasn't surprise at all. Sometimes trading is easy, such as it was last week. This week shouldn't be surprising either. Fridays session produced strong buy weekly candle.

Next target will be the 1131 resistance where the price is going to make very important decision about the path for the next few months: to resume the long term trend or to fall into down swing. If we break 1131.23 could pick up the 1148 high, where the left shoulder's resistance is.

According to the current count the "C" leg or 3th wave is still missing.

Good luck!
Jul 24, 2010


Subscribe to:
Posts (Atom)