Showing posts with label STOXX50. Show all posts

Dec 22, 2010

STOXX 50

Since the last update about STOXX 50 I changed my expectations  generally. Since March 2009 I was counting it as a bullish correction. Now the situation seems  to me different.


 The index has declined 61.49% since 6/20/2007 to 3/09/2009. According to the Elliott Wave Principle this is very close to the deepest and important Fibonacci level(61.8)%, required for second wave retrace. Then 3 waves up until 2/11/2010, and then almost one year lateral track, probably accumulating the power for the 3th Primary wave. 
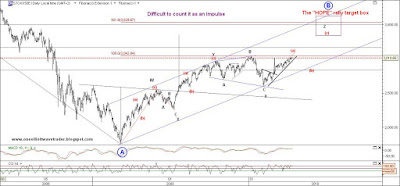
I've labeled the sideways structure as completed complex correction, finished in 8/25/2010. And then first Minor wave contains five overlapping waves, and forms typical leading diagonal. This pattern occurs usually in first of the third wave. 
The structure in four hours bars look impulsive as well, and we have five impulsive waves up, and 3 waves against the leading diagonal. 
Next resistance is 2902,39. Support  2632,89.
Most likely we are in the 3th Minor of the (1)st Intermediate of the 3th Primary. Most likely we are in long term bull market.
Next short term terget occurs 2982,48. Then 3197,48. 

Good luck trading

Apr 15, 2010

STOXX 50

                           STOXX50I is already in the targetzone of it's H&S target.

 In the last update I counted 5 waves down and supposed brief upward correction, and down again. Unfortunately it was really "five", but "C" wave of an "expanded flat".  You know......, the market is always right and never likes to make the things easy for anyone. I was in the trap as well, but smell it earlier and covered my short without profit.


Feb 16, 2010

STOXX 50- Elliott wave update

 STOXX50 index has formed very clear and reliable 5 wave impulsive pattern like  DAX. But the corrective waves structure little differs. According to the wave count. is expected (2) or (B) wave progression to at least 2.767=38.2% Fibonacci, or nearly 2.872= 61.8% Fibonacci level retracement. The situation gives us great opportunity  to take short position, chasing wave (3) or (c) ,and has reliability over 90%.  

Feb 8, 2010

STOXX 50- Elliott wave update

The structure reliability for downside impulse is very high. As you see I've labeled the move since 1/11/2010 as wave (1) (preferred count). Of course there is alternative count, which suggests the current correction as wave II of (3) to be underway, back testing the red neckline and down again.

The bigger time frame(daily) suggests couple of scenarios as well. My preferred count suggests P2 END and P3 underway. However, my expectations are for at least one more move lower. The ALT one(A)(B)(C) and new high is possible too. My doubt it based on the bigger H&S pattern since 09/03/2010, whose target is not met yet.
So, I suggest tiny  long and stop at 2,593. Exit- around 2,820.The target is good. If I am wrong, the loss will be tiny.
Good luck!
Update 2:00(GMT+2)
Individual investor's choice for next few months. Information from last week.


Sentiment Survey
Results
1/27 to 2/3


Bullish 29.2%
down 5.8


Neutral 27.7%
down 0.6
Bearish 43.1%
up 6.4

Update DJIA -daily-candlesticks 12;00pm(GMT+2)
Just sharing an idea.


Feb 4, 2010

STOXX 50

Game Change: Obama and the Clintons, McCain and Palin, and the Race of a Lifetime      The market loves to make most of us look stupid often. All what we do- chasing the market,  is something like adoring a girl. Don't you think?  We try to follow  every market move like the girl of our life. And often we got hurt by that girl, trying to pay her all of our attention and love.(sorry girls, some man point of view )
I think flirting with the market only, is the best way for success. Some people have the flirting as a gift. There is only one rule  for them- doing for fun, and no matter what's the exit.(leg over or nothing)
 Friend of mine (Ivo Gruev) wrote a book named " The Bourse- Flirt or War"  It is written there about the people, who would have the courage  and patience  to make two things: to overcome their own ego and get friends with the stock market. But it's published in my native language only.
         However let's do some work, " flattering our love".


I don't know am I wright, but I saw a possibility in European indexes. Last two hours I was "in private" with STOXX50, and a small lamp blinked over my head. By the way, in one hour bars most of the European indexes look oversold according to RSI.In  that time frame the longer lasting clues and signals are not so reliable, so I am not so sure.
                                                    There is something suspicious about that wave (2) has began from that level. Nasdaq100 didn't even touched Fibo38.2% before today's leg down.Usually it makes very deep corrections.
                                              Have a look at this chart:

                               See you tomorrow, better take a nap.
Good luck!

Jan 28, 2010

EUROSTOXX50.I- Elliott wave count

      
       One of my favorite European indexes is on the way to paint five waves downside as well.  Not much time for text, while I am at my day job.
I prepared two counts:
Alt. count.


Preferred count.

                                                       Long term expectations.

Nov 27, 2009

STOXX50 - Head & Shoulders formation


Like in the textbooks.Even my both children could recognize such a clear pattern (H&S)of the conventional technical analysis. About the waves, i did not pointed them, because i want to see the prise movement during todays session and maybe in the weekend i will make it.


The bigger picture calls for short.There are few signs according to Dow theory.Broken trend line, lower bottom and lower top, but I still doubt about long term shorts, because (Y) wave has not 100% of (W) wave's size.That is around 3.043.
Have a look.


Good luck!