Jun 30, 2010

DAX - Elliott wave update

In 2007 I noticed DAX and other EU indexes made their high few months earlier (June,July) than their US famous brothers- October. But they bottomed in March 2009 almost together ( 3 days difference ). I'm just curious- is there any correlation to follow?  
The chart bellow promises possibilities for as I said in previous posts about DAX- wide range day to swing trading. Be prepared.

SP 500

Last week the price rebounded very impressively from the 1*1 Gann Angle downwards.The next and relatively powerful support is 1037, which was tested very timid yesterday. If this week closes underneath we would have a significant medium term sell signal, that would lead the price to the first sell target at 1000 to 1008. If we rebound next two trading days from the neckline, then could see the right shoulder, and even above-1150. All depends on the next few trading days.


Jun 20, 2010

SP 500 The bulls woke up again

       This mornings price action confirmed strong bullish signal breaking the main 1*1 Gann angle.  There are overbought conditions in four hours chart and lower time frames, so we can reckon on brief pullback, testing the 1*1 angle and potential "A"wave support . If the price refuse to break the "A" wave and 1*1 angle support  will be setup the perfect long entry again. 

Good luck!

Jun 11, 2010

DAX - Elliott wave update

I am glad to be back in the race - too busy lately. 
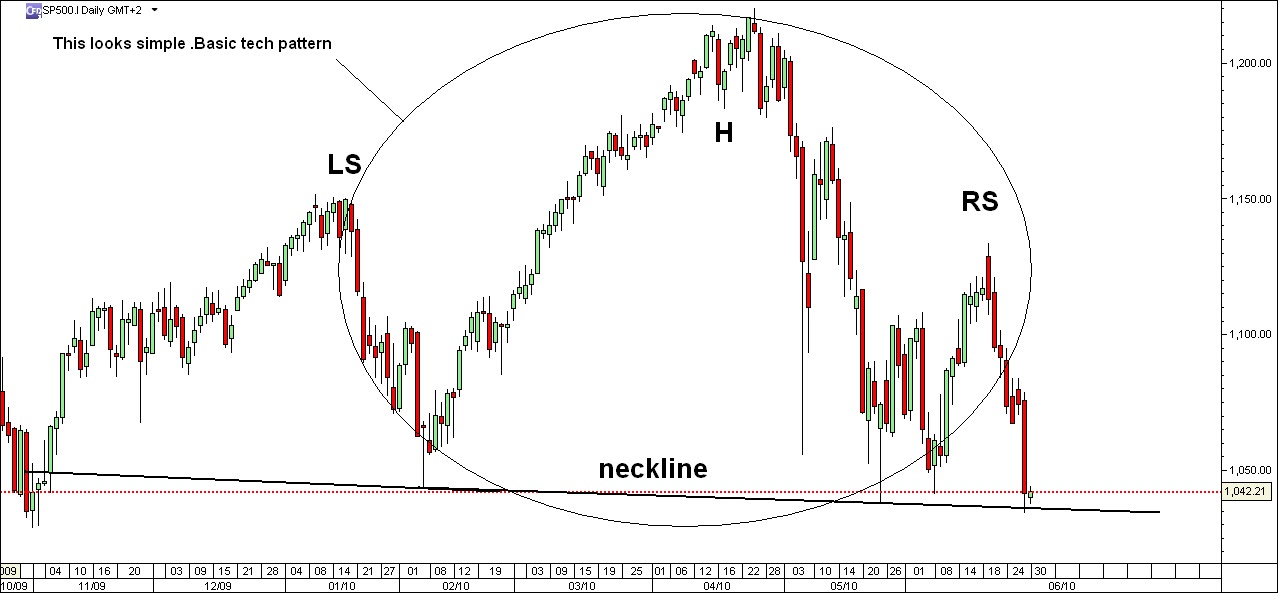
Probably the down swing, which began in 04/26/2010 will not last for 34 trading days but more likely for 55, will see.The daily chart below shows my primary pattern, which tends to be formed next weeks. (in my favor:-)


The chart below shows the primary labeling, which differs a little since my last update. I left the impulse five as an alt. count this time, because I am not so sure. I've got some different signals, but nothing is decided yet. It depends very much on Monday and Tuesday. The price could continue toward to 6300, but only if the battle zone between the thick red lines is overcame by the bulls. 6300 is100% of potential  A wave of a zig-zag, and [b] wave of a potential triangle. 
If the red zone resists, then we could find another previous lows (5605) test.
Have a nice weekend !

Jun 2, 2010

DAX- Elliott Wave Update

After clear five waves and 38.2% Fibo pull back against the five, usually I jump into the market. I did it yesterday being long again, chasing potential "C" or "3". 

I expect hitting the possible target (around 6215) in 11th of June 2010 due to my time calculations, based on the  Gann Theory.