Showing posts with label SP 500. Show all posts

Feb 12, 2014

S&P500 Update

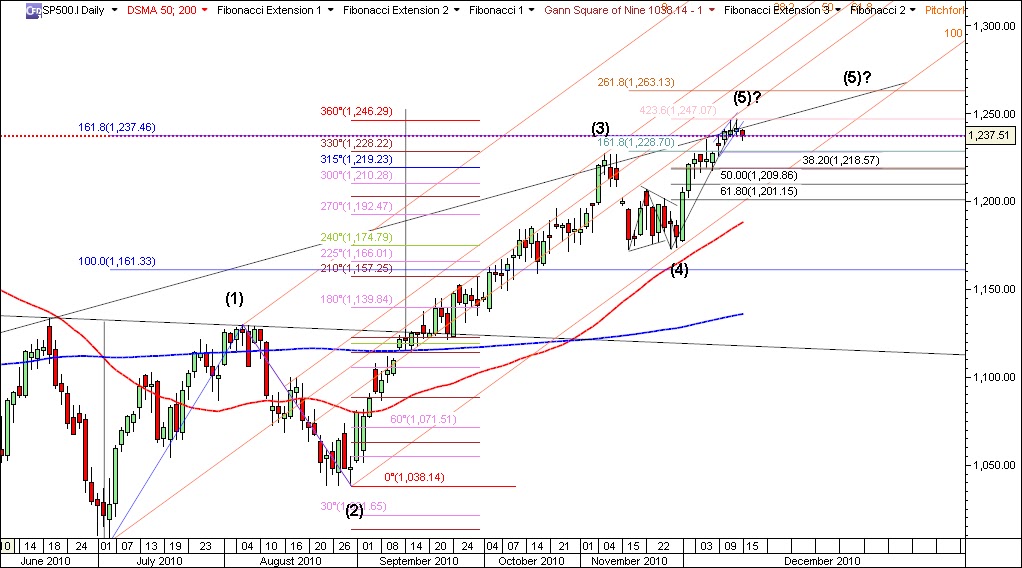
            The upward move since 28/18/2013 1966.26 low  looks quite impulsive, and therefore I have labeled it as an impulsive. According to this count 1851 high should be the first Minor of fifth Int. The 1737 low is labeled as Minor 2 or the begining of something else.
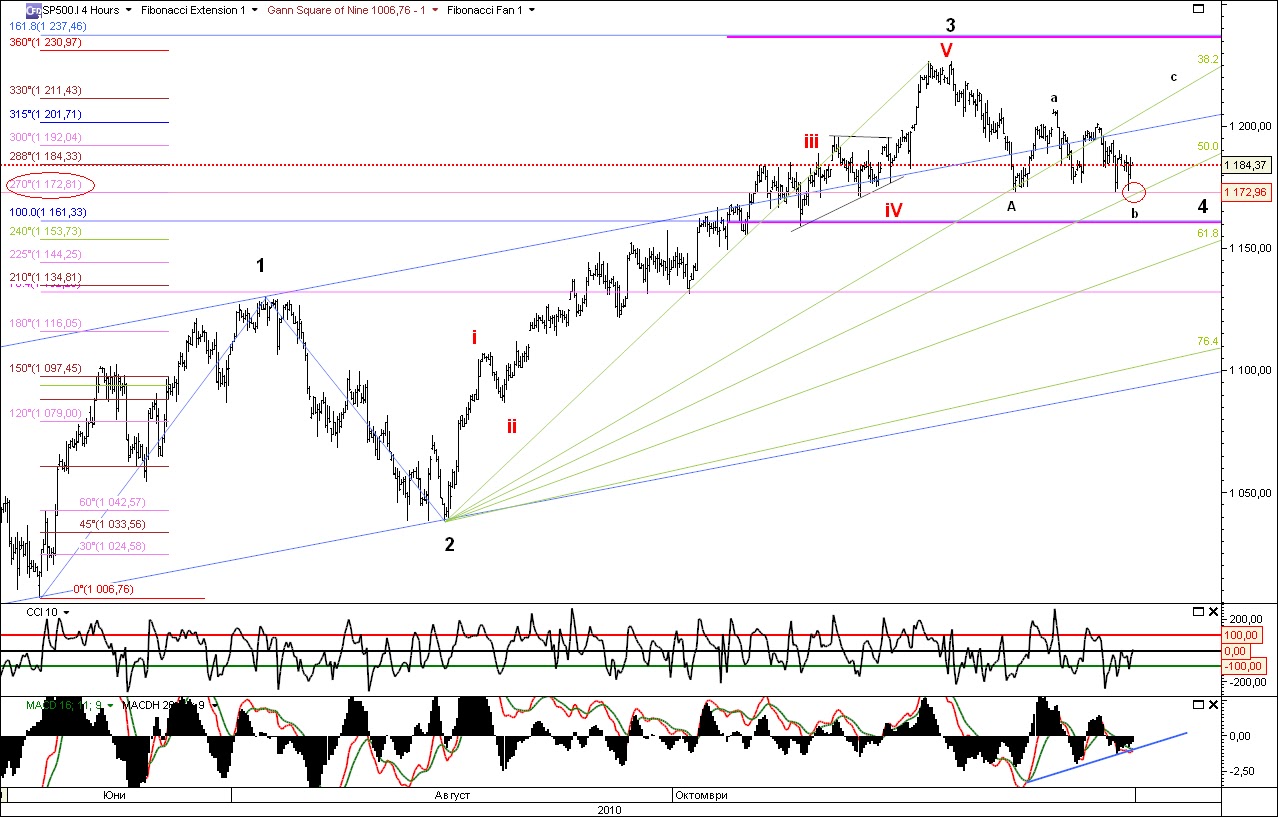
            Short term my indicators looks overbought, nevertheless I will wait for one more small 5 of Minuette degree to complete the impulsive five of Minute 1st. If not, the current very short term count should be discussed again. The blue horizontal lines are short term support resistanse zone.
          Few of the main EU Indexes I observe (AEX25,STOXX50,DAX30,CAC40), are on their way to meet old resistanse zones. 

I will leave my long term count the same about now.

 I will discuss my favorite EU Index AEX25 soon.
Good luck to all.

Feb 7, 2014

SP500 Update

Most of the EU and US Indexes met key levels and did the "unexpected" very sharp bounce (SP500) from 50% Fibo level of potential  Minor1st of Intermediate 5th of Primary 3.

Next chart is the SP500 volatility and as we see we'll get back on the bull trend. 
Good luck to all.

                        Learn Basics of Elliott Wave Analysis -- FREE


Feb 5, 2014

SP 500

          Medium term SP500 might found support at 50% Fibo retracement of potential Minor first of Intermediate fifth of Primary third wave sinse 3/6/2009. The price could drop to lower  $1710 level and hit 61.8% Fibo.


       This suggesting is based on the Fibonacci extention sequence, i.e. every third wave in this bull market unfolds to 161.8% Fibo of the first wave. If we follow this ratio then Primary wave three target should be far and away from here.

Dec 6, 2012

S&P 500

      I suppose the last move down to correct at least 38.2% Fibo of this rally, which has started at 16-Nov-2012 and finished at 3-Dec-2012. 
I've labeled 1403.74 as minute A wave down, 1415.22 as minute wave B up, and would expect C wave down to unfold. I have labeled B wave as Expanded Flat. 

     Short term resistance remains 1415.22, and then 1424.81. Short term support remains 1397.57. If the price goes up from here and overcomes the resistance at 1424.81 I have to negate this count, in this case 1397.57 should be Minor wave 2.
-->
Happy trading!

Jun 26, 2011

S&P 500 Week for reflection

        Next week suppose to be one of the important weeks for the S&P 500. 
       We have already 8 weeks decline and the price has already touched the important  Gann Angle closing above it. I pay attention to the number 8, because it is included in the Fibonacci sequence, and has it's importance. The odds are extremely in favor of a significant rebound to happen here in the environment of the support, offered by the Gann Angle, 200 day moving average gives price support as well. A reversal daily/weekly candle will be one of the signs for rebound. 
       I can also assume spiking weekly candle, reaching 1250 even 1232, with closing weekly price above 1247.80.
       The Elliott Wave pattern that has been forming for several months (2/22/11 - now) is running flat(3-3-5) in case the price doesn't break 1247.80. If does break it, the running flat turns into expanding flat (3-3-5).  
Good luck trading!!!


Jun 8, 2011

S&P 500 How strong is the fear

      The old saying - ' sell in May and go away ' , "pulled the market down again". It is a fact that US indexes have been faling as long as five weeks, and the fear melts the prices as always. 
       Exactly at  1266/20.06.2011 passes the 45 degree Gann angle with a start point 665.83/06.03.2009. Around that level the bulls should take control again and lead the price at new year high around 1393, marking a new top.
Good luck trading!

Apr 20, 2011

S&P 500 The bulls are back

          As you may see the price refuses to decline more than 50% of the entire bulish move (3/16/11 - 4/6/11).  The daily closing price was also higher than the resistance 1293.41, which undoubtedly gives us clear buy signal. Safe place for SL is 1298. Most likely he price will continue up next few weeks. 1375 looks like an imminent target. As time is more difficult to determine, but around these periods med term top could occur (May 3-10) or (May 21-28).
Good luck trading!

SMS-service in 5 minutes
Asia, Nordic and Baltic countries
and Eastern Europe!
fortumo.com

Apr 7, 2011

SP500

    One month later the daily picture doesn't change much. According to my Elliott Wave count we must be in 5th Minor of (1)st Intermediate of 3th Primary. 
    The price still moves in track and longer term bulls control the ball. Since early July 2010 the market has been following this bullish setup. We should see rising prices at least few more weeks. My expectations for Intermediate top are in the range between 1375 - 1393. Will the saying "Sell in May and go away" will stay valid this year....
     In four hour chart I have included my Gann Angle Calculator, which is made in excel. It helps me to determine the support and resistance levels in advance as degrees, percent and price points.
Good Luck trading!!!


Mar 7, 2011

SP500

We have third attempt to break the lower blue line. That undoubtedly means BUY signal. Target - the same.
Good trades!!!

Feb 4, 2011

SPX Friday Observations

 The 5th wave probably will not be as short as regularly is, and most likely I will assume on extended fifth to 1361-1378 range. I changed the (5)th wave count a little. It is similar to the count of friend of mine. 

In bigger time frame the picture still looks bullish. Since 1/3/2011 the price is something like "trying to escape from the expanding blue triangle chains"' but still not able to make it. The upper line keeps the closing daily price bellow and the lower line keeps it above. 
1361 looks like a price magnet, because 1360.65 is 261.8% of the (1)st wave, and 1361.01 is 100.00% of the (3)th wave. Untill we don't see breakthrough the triangle chains in weekly base before reaching 1361, I will reckon on this scenario.
Good luck trading!


Jan 13, 2011

SP 500

As long as the price continues to climb,  the ice under our feet becomes thinner and thinner at the same time. 
I come up with a slightly changed wave count, see the chart below. The price just touched 1287, which suggest lateral track for the rest of the session. The scenario stays valid- projected target 1304 . Better to stay away while this last wave unfolds.
We'll have almost 30% rise since 7/6/2010 if 1st Major finish around 1304-1315.
Good luck trading!


Jan 6, 2011

SP 500

Yesterday's price action didn't violate the tight trend channel. Market closed above the 1270.75 pivot, which sugests testing the next pivot and Gann angle 1287.25. Most likely the price will hit 1304 later this month. According to this count we are in the middle of Minor wave 3 of Intermediate wave 5 of Major wave 1. Breaking 1254 will negate the Minor count.

Long term (daily) conditions still look steady and bullish despite the slightly overgought  indicators. Bullish action remains on track.  Reaching 1304-1315 pivot area will probably produse more violent decline. Until then we stay bullish.  
Good luck trading !


Dec 15, 2010

SP 500 Update

       The correction might begun during the yesterdays session. I still think, that we are in 1st minor of (5)th Intermadiate and wait for more significant pullback to label correct. 
There is one main question:  how deep will be the pullback? The well spreaded "flash crash" or just one step back, before the next two steps ahead, which is typical for the bull market. 
4 hour to daily charts show overbought and diverging conditions. 
The current pullback's depth will be very important for the market to show us HIS choise: 
to resume the uptrend, unfolding 2,3,4,5 of (5)th wave short to med term, or deeper retrace  beyond 1173? 

Next support down is the previous top 1226.78. If broken 1219.74 April top and 38.2 Fibonacci level of the current 1st wave is the next support.
Upwards 1246.75 and 1263.15.
Daily close above 1247 will be important buy signal from the current point.
Good luck trading!


Dec 9, 2010

SP 500

 Short term is expected 25-30 points pullback.
The night session registered new year short term top at 1236,97 and probably marks 1st minor of (5)th Intermadiate. This Elliott wave count appears on one very short term only. The five wave structure looks completed and wave 2 minor is underway.
Medium term - the bulls control the situation and there is more room upwards for the price to go. After brief few days pullback the Santa rally will resume. The next price magnet and important Gann angle influence  apears to be 1279 in the second half of January 2011, where the (5) intermediate will be completed.
Good luck trading!

Nov 30, 2010

SPX 500

I've got a reason to consider wave A minor  of a potential triangle completed.
 1 173 became strong support. Once broken the price will meet next support  at 1 154.


Nov 25, 2010

SP 500

     Hey Wavers, It's been difficult lately...., I know...Between the Flash Crash and believing in the real evidence-long term.
    I was lucky and happy to nail the 2007-2009 slide. It will be a good story for my grand children.
 I know ....we know ...it was very  fast and profitable.
What is the essentials of the EWP?...1-2-3-4-5..... a-b-c? THEN 1-2-3-4-5.... and a-b-c again.
 Do you know that SP500 has retraced more than 50% since the top in 2007 till March 2009.
 ....Probably This is the old  Bull Market.


Nowadays ...


  It  will be very difficult  for the bears to continue the pullback, and reach 1172  again after todays ignition.  
  Breaking 1195 downside was a good  sign, that I was wrong about my latest count. Wave four Minor is the better suggestion for the current scenario. It hasn't retraced 38.2% but it can be valid as well.   I like the triangle idea, but it needs little more time to unfold.


Nov 11, 2010

SPX - Cash Index

        More than 2 months the bulls control the ball, slightly tired, but still in the game. Yesterday's pullback produced green bullish candlestick with not so high reliability. 
Probably 4 minor wave is forming now. Minor 4th wave is particular wave pattern, and needs it's time. We got only 3 days after toping 3th minor. That's why the correction doesn't look finished yet. I have to relabel in case the price bounce up for new high today or tomorrow.
Possible test level- 1195
Target- 1237


Good luck!

Oct 24, 2010

SP 500 - Bear balls on fire

Last 8 weeks  SP500 rose slowly and steadily. Currently I don't expect 
deeper retrace before hitting the 1235 new high. Yes higher prices. It is also 161.8% Fibonacci of i or A wave.

Since 1007 low the market has risen 5 weeks as initial impulse, then 3 weeks corrected. After the 1038 support we have 8 up- all Fibonacci numbers. 5+3+8=16. Next number in the sequence is 21. So if we can reckon on that count need at lest 5 more weeks to extend, which makes the week  11/22 -11/28/2010.
Good luck!


Sep 20, 2010

SP 500

 Despite the ongoing weakness in the real economy, last week was very good and positive for most of the world indexes. 
  As I said in few posts ago I am working on the assumption that the main (bullish) trend resumes and the correction (1006 low in 7/6/2010) marked the "B" Primary wave in my count. There is a small possibility for deeper retrace into 50.0% of the entire move up since March 2009, but it's too early to think and talk about it. Now we are chasing the pointed 1170 target. 

Sep 7, 2010

SPX 500 Very short term - wait and aim.

Impulsive 3th or just an ordinary C of "zig-zag", It definitely worths to get in (long). But maybe later this week  or next one-when the pull back is done. Around 1073.
Good luck trading!