Nov 30, 2009

No title


Bull & bear gambling.............


Gold is still shining...............


Ben promises prosperity............


And market rumor is going on.......as usual....

.

World ends in 2012? by Matheis, Shelley


Nov 27, 2009

STOXX50 - Head & Shoulders formation


Like in the textbooks.Even my both children could recognize such a clear pattern (H&S)of the conventional technical analysis. About the waves, i did not pointed them, because i want to see the prise movement during todays session and maybe in the weekend i will make it.


The bigger picture calls for short.There are few signs according to Dow theory.Broken trend line, lower bottom and lower top, but I still doubt about long term shorts, because (Y) wave has not 100% of (W) wave's size.That is around 3.043.
Have a look.


Good luck!

Nov 26, 2009

DJIA & GOLD

            When someone says the financial bubble has burst, we all know what "burst" means: A decline in stocks, indexes and real estate. Yet a few people realize that the "bubble" itself involves more than just asset values -- it also involves psychology. And it's really important to distinguish between assets and psychology, for this simple reason: the end of bubble asset values does not mean the end of bubble psychology.


In fact, mini-bubbles can happen after the big bubble has burst.


              Depending on how big the big bubble was, it can take a long time and a lot of losses to extinguish the psychology that drove it. It's easy to understand if you think about it. If things are not so good now, and better times are in the past, it won't take much to get the old enthusiasm going.


            Too much enthusiasm based on too little evidence is common to all bubbles, big or small. So here's where it gets tangible.
Gold prices have recently pushed to all-time highs, the Dow Industrials to a new yearly high. But gold and the Dow have done this alone, as in NO other equity indices or commodities have followed.


              Now which markets get all attention in the media? Gold and the Dow, of course -- to the point that people think the performance of these two markets is not the exception but the rule.


               Too much enthusiasm, too little evidence.


                                                              I attach an example chart.


Nov 25, 2009

DXY - USD Index - Falling Ending Diagonal


Sorry, i didn't have time yesterday for more charts.
But US Dollar Index seem to form an "ending diagonal".
It is expected to reverse according to most of the technical theories.
Also the sentiment indicators are very bearish (over 90%).It means that very soon there will be no buyers.
I pointed one of the potential Pivot points which might be the key level for reversal.


Nov 24, 2009

DJIA - wave count


According to my count,  all short term bullish positioned traders should cover their positions.
I will cover my point of view  with some examples.
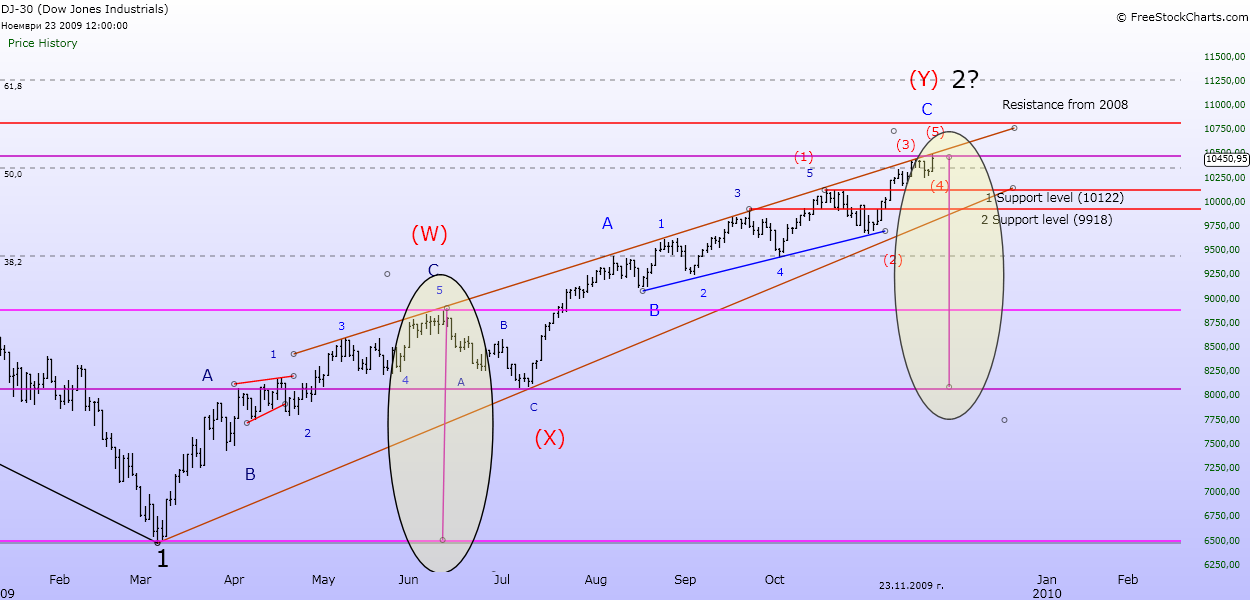
First one  shows my count, i changed at the last moment yesterday.


Second one hsows how low is the daily volume. If tomorrows sessions make similar or lower volume, we should expect dropping  down shortly.


The third chart shows us how the price has reached 50% of Fibonacci retracement of all downside move since October 2007.


On fourth  chart we see that wave (W) is equal to wave (Y) by size.


After all charts i can not confirm beginning of Primary wave 3, because i want to see more confirmations about it. But i think we have to expect short term bearish movement and want to see will  the support levels   resist i pointed. Later today i intend to post few more charts for European market probably , so be in touch.
Good luck!