Showing posts with label DAX. Show all posts

Dec 22, 2011

DAX

The EU market is upside oriented today as well. I can suggest to play this bullish strategy as long as the market does not go below 5773. I expect a direct rise to 6062. Buy around to 5890 to play a rise to 6062. The invalidation level  is at 5773.
                                                                      Good luck#

Oct 25, 2011

DAX

      DAX may have finished the dipping  toward the bottom already. Since May/2 /2011 DAX unfolded in three clear A,B,C waves, and bottomed in Sep/12/2011. This bottom suppose to be the END of the Bear market/correction. The C wave lays right on the line of 423.6 % Fibo of A wave, and close to 61.8% of the whole bullish move since Mar/9/2009.
 The price action imposed bullish tune in my analysis on daily base. The waves look very clear, to be counted, and no doubting - this should be resuming the bull market. 
Good luck trading!


Apr 15, 2011

DAX - Elliott Wave Update

Last European more significant bear correction srarted 07/2007 and botomed at 03/2009. It unfolded in three waves A,B,C, and declined 56.11%. The B wave was nearly 161.8% of the A wave. Then the long term bull market probably resumed. The price paints fifths so far. When reached the B wave resistance, the price made very sharp counter reaction, and prodused reversal monthly (03\2001) candle (hammer).

The A,B,C pullback hit 61.8% Fibonacci level of the entire 1 st wave.

Good luck trading!

Dec 8, 2010

DAX

Yesterdays session marked the pick of "i" of 5th wave. The expected pullback won't be deeper than 6760 probably.
Good luck trading!

Nov 9, 2010

DAX - Elliott Wave Update

     In Friday DAX closed within the target (6754), that I offered in my post in the late July. 
Very interesting lines crossing has occurred when conecting few tops and bottoms, whose spot is going to be next few days. Usually around such  spots the price turns. 
    According to the current count (4)th and(5)th waves are still expected. Probably the (3)th wave is not finished yet. Don't reckon on sell off, becuse the lowest "alowed" price level acording to the scenario is 6550.   The long term trend is up, and  shorting the market on daily base is risky and no preferable. Lower time frames will be suitable for daytrading.
Good luck!


Sep 13, 2010

DAX -Elliott Wave Update

    Very interesting and rising wedge looking pattern is forming on daily and weekly base. My first look defined that pattern as trend reversal, but the the whole formation's wave structure  put some bullish tune.
     Last week closed exactly below  6213, relatively near the week high (6235). After the positive week the market opened higher in Monday as I expected. First possible target matches with 6420 price. It's worth to be long now.
The wave structure on daily and 4 hour base defines that pattern as nothing more than bullish "running flat" for now. The plunge above the current resistance levels is expected in September.

Good luck trading!

Jul 27, 2010

DAX - 6352-Down behind my shoulder

In my last update about DAX I was expecting "expanded flat". The "flat occurred, but the"running"one-A,B,C.  It's not a secret that I am deadly bullish on daily to weekly base about some EU indexes including DAX, but expected little different pattern (expanded flat). 
As usual the market loves to make us look stupid- often. I still support my bullish bias, due to the strong daily and weekly signals. There is not much text to add to the current count. I reckon on small and brief pull back next one-two days to get the "long" path again.


Good luck!


Jun 30, 2010

DAX - Elliott wave update

In 2007 I noticed DAX and other EU indexes made their high few months earlier (June,July) than their US famous brothers- October. But they bottomed in March 2009 almost together ( 3 days difference ). I'm just curious- is there any correlation to follow?  
The chart bellow promises possibilities for as I said in previous posts about DAX- wide range day to swing trading. Be prepared.

Jun 11, 2010

DAX - Elliott wave update

I am glad to be back in the race - too busy lately. 
Probably the down swing, which began in 04/26/2010 will not last for 34 trading days but more likely for 55, will see.The daily chart below shows my primary pattern, which tends to be formed next weeks. (in my favor:-)


The chart below shows the primary labeling, which differs a little since my last update. I left the impulse five as an alt. count this time, because I am not so sure. I've got some different signals, but nothing is decided yet. It depends very much on Monday and Tuesday. The price could continue toward to 6300, but only if the battle zone between the thick red lines is overcame by the bulls. 6300 is100% of potential  A wave of a zig-zag, and [b] wave of a potential triangle. 
If the red zone resists, then we could find another previous lows (5605) test.
Have a nice weekend !

Jun 2, 2010

DAX- Elliott Wave Update

After clear five waves and 38.2% Fibo pull back against the five, usually I jump into the market. I did it yesterday being long again, chasing potential "C" or "3". 

I expect hitting the possible target (around 6215) in 11th of June 2010 due to my time calculations, based on the  Gann Theory.


May 28, 2010

DAX - Brief Elliott wave update

           To be honest, I didn't expect such a fast and sharp acceleration of yesterday's price movement. And that "corrective"  bounce up is on really serious doubt. I expect test at 5905 support and then up to 6031 resistance, where my first target is.

May 26, 2010

DAX - Possible lateral track next weeks in wide range

DAX's reaction last week was very calm comparing it to the rest of the world indexes. DAX is one of the EU indexes which can give a clue for market direction before the others. As you noticed NASDAQ100 refuses to decline as well, and bravely defends its low since 5/6/2010. That also should be a clue for the US indexes.
     I came up with a completed flat correction, where the situation offers clear day trading buy entry.
Good luck!
P.S. Today is the monthly full moon cycle. That usually makes the bulls more aggressive!

Apr 28, 2010

DAX-Elliott wave update

       Well, the picture doesn't seem as bearish as all the bears wish (short term I am bear too).
The chart below shows my primary count, which was relabeled a little. I am just trying to fit the labels to one incomplete (to me) pattern. At other hand on daily time frame the market tries to produce reversal candle from todays low (6023). One more reason, which makes me feel little confused is the full moon cycle. According to the moon calendar today 28/4/10  is the full moon. According to my 14 months research about the connection between the moon and the stock market reminds me that todays moon influence could kick off the  market (indexes) higher. That is a fact every time, when the full moon occurs .The chart's look confuses even me. Next time I promise neater charts looking.


Apr 26, 2010

DAX - Elliott wave update

  DAX didn't get support in last few days heights.STOXX50, AEX, FTSE100 etc. denied to follow their European brother. That usually means trend change or correction in the current time frame. According to the wave count (5)th wave is not complete yet. Most acceptable price level for reverse looks around 6480 level. 


Apr 7, 2010

DAX - Elliott wave update

Since my last update, DAX and most of the world indexes decided to play another impulse up. That probably means one more "zig-zag". The price have already met 423.6% of a 1 wave, and 261.8% of the I wave, moving in very sharp and tight trend channel. Perfect Fibonacci sequence in play. So, the time and place for deeper pull back probably came already. We just need to see short confirmation. As I said: trading overbought or oversold market without confirmation is looking for trouble.
I attach PUT/CALL Ratio chart as well, where the indicator dropped to new significant low. It means sell off soon.
Probably Ben will produce last spike today.


Mar 4, 2010

DAX - Elliott wave update

The current up move (a) looks completed in 5 waves. I expect a brief action (b),  reaching 5 650 area, where is the red bear back test line. That action is also called correction of the correction  in the next upward move to new corrective high in next few weeks. I remain modestly short, and expect a lateral track for a few sessions.


Let the force be with you :)


Feb 16, 2010

DAX-Elliott wave update

                                                                  
                                                                    Good luck!

Feb 14, 2010

DAX-Elliott wave update

                                                              Happy Valentine's Day !!!
Almost nothing changed since my last post about DAX. I still expect (2) or (B) wave progression to at least 5.655=38.2% Fibo, or 5.821=61.8%  Fibo. I missed 50.0% Fibo, because that level matches  resistance peak at 5.738. If the price action break that resistance, possibly the price will run after at least 61.8%Fibonacci.
Most probable reversal levels-5.666 and 5.796.

Feb 11, 2010

DAX-Elliott wave update

Since my last post about 
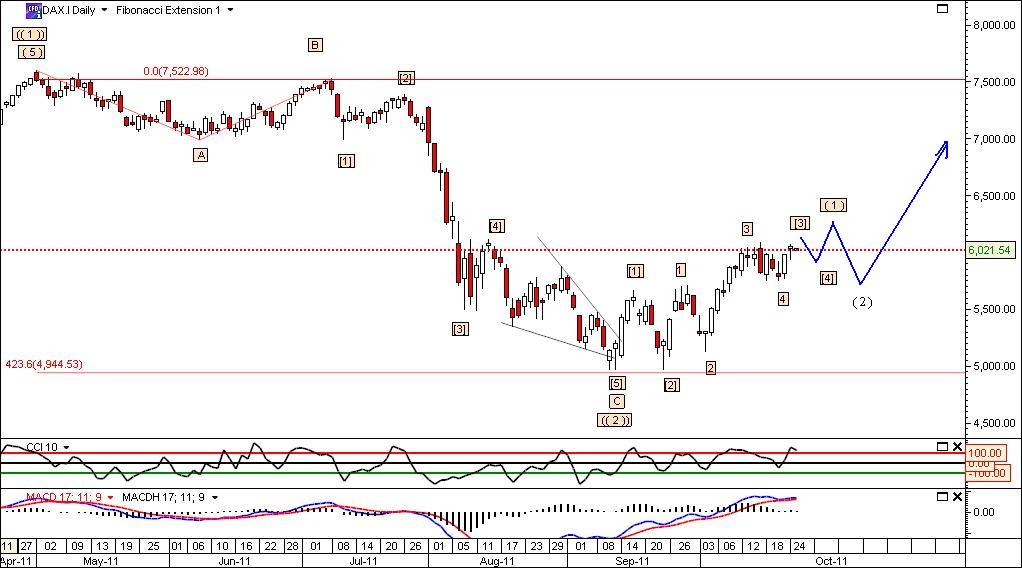
DAX  I've changed the wave count a little, but the pattern hasn't changed, just a bit extended. As you see my expectations are for corrective (2) or (B) wave, which is on the half way according to this count.
 Usually I can't afford to suggest and trade corrections, but in this case (bigger time frame) I did it anyway. And ready to cover in emergency around 38.2% Fibo. My trade and picture about  STOXX50 is similar. I don't suggest to get in now, because it's little bit late for long trades now, I mean more risky. Better wait for the bearish train. It promises better short target.  

In daily time frame the tape hasn't change a lot. That is what i do expect. I will make a daily update when the price is closer to the red battle field.  


 Pu/call ratio is up as well, confirming my short term idea.

Feb 2, 2010

DAX 1hour chart

DAX has painted almost the same as FTSE100. The expected correcting bounce resumed. According to Fibonacci  ratio and Gann's angles the (2) wave could top around Monday-8th. Jan.nearly to 61.8% Fibonacci.