Mar 1, 2016

US Soybean- update

It is time now to trade the triangle pattern. It's possible to project the triangle's target area according to few trading strategies. 

Gann's astrological methods can help us to determine PRICE and TIME targets, which is much more than price targets only. 

 Learn Basics of Elliott Wave Analysis -- FREE

Feb 12, 2016

US Soybeans - Triangle Pattern Update


        During the yesterday's trading session the price reacted to the lower triangle line as I expected. This usually appears when the price is not ready to breakthrough the triangle. Sentimentally it means the buyers and the sellers have equal strengths and positions, painting sharp and nasty moves in range. 
Good luck waiting!

Feb 8, 2016

US Soybeans - Triangle Pattern

        Since last September US Soybeans has been moving sideways painting pretty nice triangle pattern. According to few technical theories the price target should be projected to the downside, but not before breakthrough the lower line of the pattern .  Untill then we are doing nothing.
Please wait for update.

Jan 15, 2015

AEX25.I

         Recently I observe the main Dutch AEX25 and test few W.D.Gann methods.
At the chart I have applied few astrology methods (fourth dimension, first trade horoscope, planetary longitude conversion into prices and planetary aspects which cause price reaction). I applied all these method  manually as Gann did nearly hundred years ago.


Feb 12, 2014

S&P500 Update

            The upward move since 28/18/2013 1966.26 low  looks quite impulsive, and therefore I have labeled it as an impulsive. According to this count 1851 high should be the first Minor of fifth Int. The 1737 low is labeled as Minor 2 or the begining of something else.
            Short term my indicators looks overbought, nevertheless I will wait for one more small 5 of Minuette degree to complete the impulsive five of Minute 1st. If not, the current very short term count should be discussed again. The blue horizontal lines are short term support resistanse zone.
          Few of the main EU Indexes I observe (AEX25,STOXX50,DAX30,CAC40), are on their way to meet old resistanse zones. 

I will leave my long term count the same about now.

 I will discuss my favorite EU Index AEX25 soon.
Good luck to all.

Feb 8, 2014

Linear or Logarithmic scale?

             We all live in an exponential world, and many of the market analyzers use that fact  in their analysis.
The main problem comes from fact, that sometimes analyzers use linear, sometimes logarithmic graph.
            You can't use log scale and make linear calculations, and the opposite.
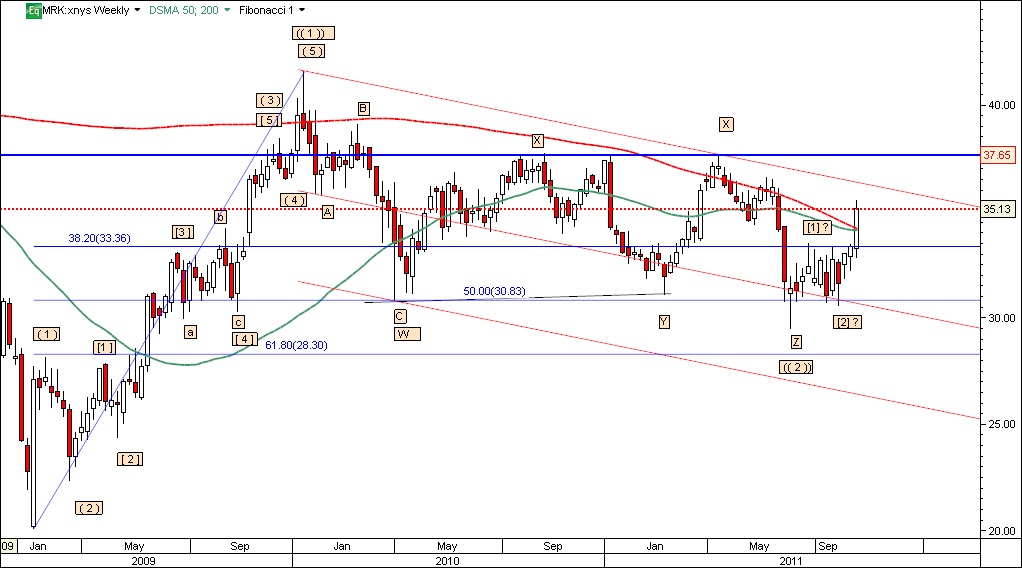
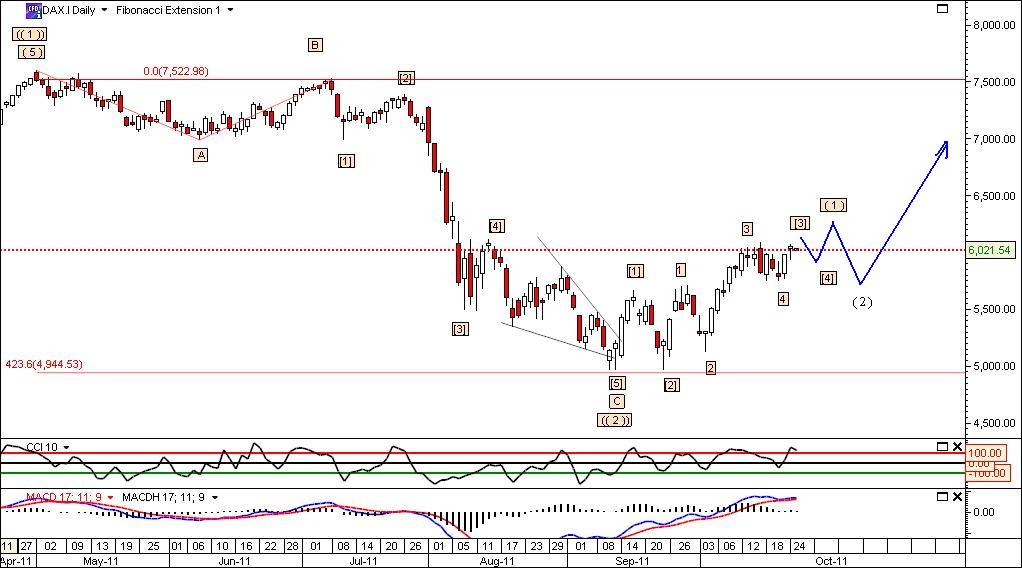
              Have a look at the both graphics bellow:


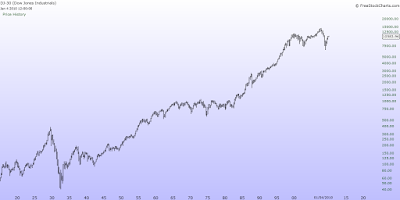
               At first hand they look totally different, and have nothing common. More observant of you have already noticed, that on both is DJ 30.

               Here is an interesting example:


              Let's suppose that you have invested $1000 in General Electric for $8 per share in 1995, it makes 125 shares. For two years the price rises to $16 and you cover the long, taking $8 profit per share in the pocket, which makes 100% profit.
             Few years later the price rises to $30, and you decide to buy your favorite instrument again. But this time you spend $1000 to buy only 33 shares. However, the price is going higher, reaching $60 in 2000. Then you decide to sell again, taking profit $30 per share, which is 100% profit again. Visually the spread between the blue lines is four times wider than the red ones. It's easy to make a mistake, that the second trade's profit is four times bigger. It is so, because the graphic is linear.

            Here is the same GE logarithmic scale example:
                             

      I have calculated GE Fibonacci retracement levels of the move from $8 to $60 in both ways:


Fibo                         38.2%
50%
61.8%

Linear                     38.9
33
27.1

Logarithmic       27.21
21.54
17.05


        If we follow the linear calculating, could make a conclusion that GE's 61.8%Fibo retrace is nearly ($27.10)  of its rising up, and as an ewavers using Fibonacci tool to expect bounce up again.
        The picture is totally different, if we have calculated that correction in logarithmic way. It is obvious, that 61.8% of the correction is nearly $17, and there is more dropping down.
                                                                
                                       The main question is:  Which scale to use?

  •  If we are daytraders, can use both, because the difference  is very small.
  •  If we are swing or longer term traders or investors- the linear one.

        P.S. The prices now differs , I just use an example graphs.

Feb 7, 2014

SP500 Update

Most of the EU and US Indexes met key levels and did the "unexpected" very sharp bounce (SP500) from 50% Fibo level of potential  Minor1st of Intermediate 5th of Primary 3.

Next chart is the SP500 volatility and as we see we'll get back on the bull trend. 
Good luck to all.

                        Learn Basics of Elliott Wave Analysis -- FREE


Feb 5, 2014

SP 500

          Medium term SP500 might found support at 50% Fibo retracement of potential Minor first of Intermediate fifth of Primary third wave sinse 3/6/2009. The price could drop to lower  $1710 level and hit 61.8% Fibo.


       This suggesting is based on the Fibonacci extention sequence, i.e. every third wave in this bull market unfolds to 161.8% Fibo of the first wave. If we follow this ratio then Primary wave three target should be far and away from here.

Dec 6, 2012

S&P 500

      I suppose the last move down to correct at least 38.2% Fibo of this rally, which has started at 16-Nov-2012 and finished at 3-Dec-2012. 
I've labeled 1403.74 as minute A wave down, 1415.22 as minute wave B up, and would expect C wave down to unfold. I have labeled B wave as Expanded Flat. 

     Short term resistance remains 1415.22, and then 1424.81. Short term support remains 1397.57. If the price goes up from here and overcomes the resistance at 1424.81 I have to negate this count, in this case 1397.57 should be Minor wave 2.
-->
Happy trading!

Dec 5, 2012

NASDAQ100

There is short opportunity on NASDAQ100 in hourly chart. The Head and Shoulders figure is the very well known pattern from the Dow theory.  The target should be around 2628 level. I also expect C wave to unfold and fill 100 % of A wave which is somewhere arround these levels (2632). A wave starts at 2698.54 and marks short term top.


Dec 22, 2011

DAX

The EU market is upside oriented today as well. I can suggest to play this bullish strategy as long as the market does not go below 5773. I expect a direct rise to 6062. Buy around to 5890 to play a rise to 6062. The invalidation level  is at 5773.
                                                                      Good luck#

EUR/USD

An imediate drop is expected on the forex market. The market is downside oriented today. It's preferable to play this bearish scenario  as long as the market does not go above 1.3183, as I anticipate a direct drop atleast  to 1.2944. Sell close to 1.3133 to play a drop to 1.2944. The invalidation level of this trade idea is at 1.3183 levels. 
Good luck trading@


Nov 2, 2011

MRK - Merck & Co Inc.

                      Merk & Co Inc. has reliable fundamental parameters and technical patterns to be added to your portfolio.
  • Merck makes pharmaceutical products to treat conditions in a number of therapeutic areas, including cardiovascular disease, asthma, infections, and osteoporosis. The company also has a substantial vaccine business, with treatments to prevent hepatitis B and pediatric diseases as well as HPV and shingles. Following the Schering acquisition, about 45% of the company's sales are generated in the United States
  • Merck remains in strong financial health, even with the additional $8.5 billion in debt needed for the Schering acquisition. We expect the combined company will generate a free cash flow of approximately $12 billion in 2011.
  • Merck's new products during the last few years have helped to offset recent patent losses, Januvia for diabetes and Isentress for HIV.
  • Merck's efforts to develop a reliable late-stage pipeline have yielded questionable results. The Food and Drug Administration denied Merck approval for cholesterol drug Tredaptive (formerly Cordaptive) in early 2008.
  • Deciding not to wait for new internal pipeline drugs, Merck significantly strengthened its operations by acquiring Schering-Plough for about $40 billion. Schering brings in a very strong pipeline of late-stage drugs with blockbuster potential and faces only limited patent losses during the next few years.

                                           Current Valuation


 MRK


MRKIndustry AvgS&P 500MRK 5Y Avg*
*Price/Cash Flow uses 3-year average.


             Risk
  • Merck's near-term risk largely centers on market acceptance of new products. Like all pharmaceutical companies, Merck faces regulatory risk from the FDA. Product delays or nonapprovals could hurt the stock. Also, the growing power of managed care and a more price-sensitive U.S. government may reduce Merck's pricing power. 
        Bulls say
  • New product launches of Isentress and Januvia leaped to a strong start, and delays of competing drugs have given Merck a leg up in maintaining market leadership
  • Restructuring efforts should reduce costs and improve margins over the long term, helping to offset the patent expirations of high-margin products.
  • The acquisition of Schering enables Merck to potentially achieve $3.5 billion in annual cost-saving synergies by 2011.
        Bears say
  • Merck faces the loss of its largest sales contributo when the 2012 patent on Singulair expires.
  • Poor trial results from a key Schering pipeline product called TRA casts a cloud of increased uncertainty over the other pipeline products acquired in the Schering acquisition.  
  • Poor results from the Enhance study combined with increased generic statin competition could reduce the market potential for Vytorin and Zetia.


Technical overview 

  •          The current price action has a lateral track with slightly down side bias. I still can't say this share has a BUY signal. I need to see overcoming the $37.65  resistance first and closing above the upper channel line.

Good luck trading!


Price/Earnings37.016.212.540.7


Price/Book1.92.31.83.9


Price/Sales2.32.51.13.5


Price/Cash Flow10.09.28.114.9


Dividend Yield %4.43.82.53.9


Price/Fair Value0.7

Oct 31, 2011

Gold

                                  The gold has resumed its long term trend again and the current trendline keeps the bull rally intact.
                    
  • Overcoming the 1680 resistance the gold triggered its rally again. Last week was marked med term high at 1754 and the counter reaction was very moderate. 
  • The current upswing suppose to pick up speed very soon.

                             
P.S. I Forgot to mention that (4)th wave looks truncated
Good luck trading!


Oct 27, 2011

EUR/USD - Elliott Wave Update

The pair EUR/USD chose the steep direction toward 1.4550.

EUR/GBP overcame the resistance 0.8795, and turned it into support.


Support this blog into Google, and press  +1

EUR/GBP - Elliott Wave Update

       The currency pair EUR/GBP made corrective pullback, which was little more complicated  than I expected , but it's OK.  
       The pattern which I prognosticated still seems to be valid, and I still expect bounce up toward 0.8940.
       As you can see the price gives a try to overcame the 0.8787 resistance.
       I would appreciate your effort to comment the instruments, which I analyze in this blog. If you have any suggestions - I am an open source. 
                                                            Good luck trading!

Oct 25, 2011

HSI

        There is not much to be said about Hang Seng Index, except that it has ideal classic wave structure. HSI not only drew five ideal waves, but it pulled back to 61.8% Fibo. It seems that it made long term bottom and ready to take off again. 
      Hourly picture shows the chart, that is full of huge gaps. Despite the gappy structure the one can count waves perfectly. I noticed that third waves are shorter than first waves usually, but the pattern stays valid.
Good luck trading!


DAX

      DAX may have finished the dipping  toward the bottom already. Since May/2 /2011 DAX unfolded in three clear A,B,C waves, and bottomed in Sep/12/2011. This bottom suppose to be the END of the Bear market/correction. The C wave lays right on the line of 423.6 % Fibo of A wave, and close to 61.8% of the whole bullish move since Mar/9/2009.
 The price action imposed bullish tune in my analysis on daily base. The waves look very clear, to be counted, and no doubting - this should be resuming the bull market. 
Good luck trading!


Oct 23, 2011

EUR/GBP

Looks like the Euro pushes up the GBP as well.
The (( C )) wave is expected to unfold toward 0.8940.
Good luck trading!


EUR/USD

The Euro tries to climb to 1.450 in a straight direction, or pulls back to 1350 first. 
Good luck trading!