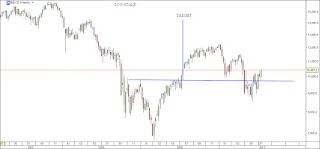
Just wanted to share with you my observations about few EU indexes.
MARKET FORECASTING, USING GANN'S ASTROLOGY METHODS, ELLIOTT'S WAVE PATTERNS AND FIBONACCI LEVELS
Jul 24, 2010
Jul 23, 2010
AEX - Elliott Wave Update
The European (Dutch) market looks bullish as well as the US one. As early as this week we'll see how strong the new rally really is. Friday performance already showed us that it doesn't seem to be the optimum. It retraced normally (healthy) at 61.8% Fibo, and as you see we are up again.
.
I've got to say that I'm not quite sure about the emerging pattern on daily base, but sure there is more room for the price to go up.
Some Dutch history
 Image via Wikipedia
Jul 22, 2010
EWI- Free week announcement
 Image via Wikipedia
Where is going the petrol value?
Our friends at Elliott Wave International have just announced the beginning of their wildly popular FreeWeek event, where they throw open the doors for you to test-drive some of their most popular premium services -- at ZERO cost to you.
You can access EWI's intraday, daily, weekly and monthly forecasts from EWI's Energy Specialty Service right now through noon Eastern time Wednesday, July 28. This service is valued at $347/month, but you can get it FREE for one week only!
The timing couldn't be better because Crude Oil and Natural Gas are both approaching important junctures. Opportunity is calling. This unique event only lasts a short time, so don't delay! Just click the on the link below or the banner above the post.
Learn more and get instant access to EWI's FreeWeek of Energy analysis and forecasts now -- before the opportunity ends for good.
You probably ask yourself : Why does that guy announces EWI services? Simple- EWI will credit me 3 bucks for each free subscription-generous donation :-) Thank you!
Some fundamental news in past tense :-) Oil edges above $77 on Europe, China optimism

Jul 20, 2010
SPX 500 Elliott Wave update
Definitely the short term picture looks bullish, even with the weak attempt to break the channel line. Anyway, this week is going to be interesting because we've got an impulse five up, which I labeled as "A" without any important resistance overcame. A short "a,b,c" correction is expected, which perhaps will try to test the previous 07/01 low. I think the price will calm down around 1035 before the next attempt to break the upper channel line.
chart updated 21/07

chart updated 21/07
Good luck trading!

Jul 15, 2010
SUGAR- Elliott Wave Update
The sugar bulls seem to be still breathing. The price tested important support and bounced up successfully for new corrective high. Most likely the price will nest at $24.56 area and then will collapse for "C" wave of a "zig-zag". There are few evidence supporting that scenario :
- The price will meet 61.8% of "A" wave.
- There is 161.8% of the corrective (a) wave.
- If we overcame 38.2% will see the right shoulder of potential H&S pattern completed, and that zone in the bigger ellipse matches with the target roughly.
- See the circled bar in red.
Subscribe to:
Comments (Atom)


