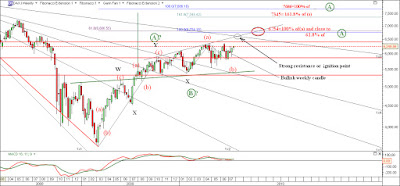
This time I come up with a candlestick count, which perfectly fits the Fibonacci Sequence numbers as tops and bottoms, taking the top, made in 4/26/2010. I have included a charting tool as well, which helps me to determine support/resistance levels and potential target zones. That tool is made, based on Fibonacci and Gann calculations. Now I am testing it. If it works properly I will continue to use it, combined with wave count.
MARKET FORECASTING, USING GANN'S ASTROLOGY METHODS, ELLIOTT'S WAVE PATTERNS AND FIBONACCI LEVELS
Aug 12, 2010
SP 500 - "Y" wave might began
Despite my expectations for higher levels the bigger pattern "W,X,Y" still remains valid, just one more stop hit, refreshing my face. So, I just have to kick myself back in the race.
This time I come up with a candlestick count, which perfectly fits the Fibonacci Sequence numbers as tops and bottoms, taking the top, made in 4/26/2010. I have included a charting tool as well, which helps me to determine support/resistance levels and potential target zones. That tool is made, based on Fibonacci and Gann calculations. Now I am testing it. If it works properly I will continue to use it, combined with wave count.
This time I come up with a candlestick count, which perfectly fits the Fibonacci Sequence numbers as tops and bottoms, taking the top, made in 4/26/2010. I have included a charting tool as well, which helps me to determine support/resistance levels and potential target zones. That tool is made, based on Fibonacci and Gann calculations. Now I am testing it. If it works properly I will continue to use it, combined with wave count.
Aug 4, 2010
CFD SP500 - One more bullish weekly signal
We have one more strong buy signal on weekly base, given by the MACD(circled in red) . I've noticed that the big shots open their thick wallets in such cases as well.
The price currently is licking the upper channel line, but it's still in.
The calculated short term target on daily base becomes more real in case we break the channel upward and close above it. Short break around 1138 could accumulate little more buying power.
Cover at 1150.
Stop at 1085 if something went wrong.
Good luck!
Aug 2, 2010
SP 500
I calculated new price target for SPX cash index. That 1149 target responds to 90 degree Gann angle. 1010,91 is taken as low point. The calculation is based on my Square of Nine calculator. We need to overcome 1131.23 first, where the 45 degree is. I think it won't be a problem for the bulls.
Jul 27, 2010
DAX - 6352-Down behind my shoulder
In my last update about DAX I was expecting "expanded flat". The "flat occurred, but the"running"one-A,B,C. It's not a secret that I am deadly bullish on daily to weekly base about some EU indexes including DAX, but expected little different pattern (expanded flat).
As usual the market loves to make us look stupid- often. I still support my bullish bias, due to the strong daily and weekly signals. There is not much text to add to the current count. I reckon on small and brief pull back next one-two days to get the "long" path again.

As usual the market loves to make us look stupid- often. I still support my bullish bias, due to the strong daily and weekly signals. There is not much text to add to the current count. I reckon on small and brief pull back next one-two days to get the "long" path again.
Good luck!

Jul 25, 2010
SP500 - 1130 is obvious
The bullish tune last week wasn't surprise at all. Sometimes trading is easy, such as it was last week. This week shouldn't be surprising either. Fridays session produced strong buy weekly candle.
Next target will be the 1131 resistance where the price is going to make very important decision about the path for the next few months: to resume the long term trend or to fall into down swing. If we break 1131.23 could pick up the 1148 high, where the left shoulder's resistance is.
According to the current count the "C" leg or 3th wave is still missing.
Good luck!
Subscribe to:
Comments (Atom)


