Jan 13, 2011

SP 500

As long as the price continues to climb,  the ice under our feet becomes thinner and thinner at the same time. 
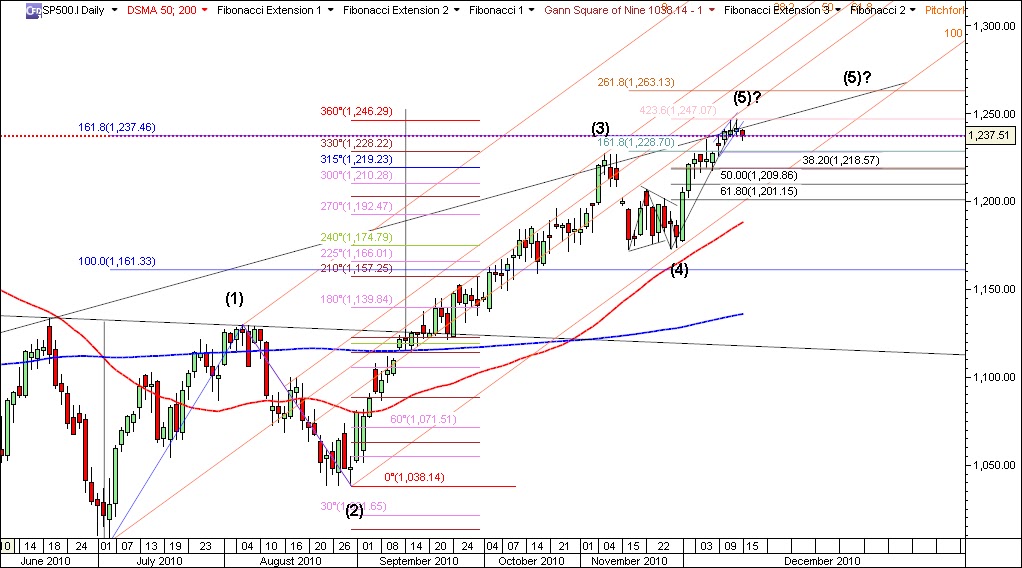
I come up with a slightly changed wave count, see the chart below. The price just touched 1287, which suggest lateral track for the rest of the session. The scenario stays valid- projected target 1304 . Better to stay away while this last wave unfolds.
We'll have almost 30% rise since 7/6/2010 if 1st Major finish around 1304-1315.
Good luck trading!


Jan 6, 2011

SP 500

Yesterday's price action didn't violate the tight trend channel. Market closed above the 1270.75 pivot, which sugests testing the next pivot and Gann angle 1287.25. Most likely the price will hit 1304 later this month. According to this count we are in the middle of Minor wave 3 of Intermediate wave 5 of Major wave 1. Breaking 1254 will negate the Minor count.

Long term (daily) conditions still look steady and bullish despite the slightly overgought  indicators. Bullish action remains on track.  Reaching 1304-1315 pivot area will probably produse more violent decline. Until then we stay bullish.  
Good luck trading !


Dec 25, 2010

SP 500

May this Christmas be so special that you never ever feel lonely and be surrounded by loved ones throughout. May this Christmas be bright and cheerful and may the New Year begin on a prosperous note.  Merry Christmas!

Dec 22, 2010

STOXX 50

Since the last update about STOXX 50 I changed my expectations  generally. Since March 2009 I was counting it as a bullish correction. Now the situation seems  to me different.


 The index has declined 61.49% since 6/20/2007 to 3/09/2009. According to the Elliott Wave Principle this is very close to the deepest and important Fibonacci level(61.8)%, required for second wave retrace. Then 3 waves up until 2/11/2010, and then almost one year lateral track, probably accumulating the power for the 3th Primary wave. 
I've labeled the sideways structure as completed complex correction, finished in 8/25/2010. And then first Minor wave contains five overlapping waves, and forms typical leading diagonal. This pattern occurs usually in first of the third wave. 
The structure in four hours bars look impulsive as well, and we have five impulsive waves up, and 3 waves against the leading diagonal. 
Next resistance is 2902,39. Support  2632,89.
Most likely we are in the 3th Minor of the (1)st Intermediate of the 3th Primary. Most likely we are in long term bull market.
Next short term terget occurs 2982,48. Then 3197,48. 

Good luck trading

Dec 15, 2010

SP 500 Update

       The correction might begun during the yesterdays session. I still think, that we are in 1st minor of (5)th Intermadiate and wait for more significant pullback to label correct. 
There is one main question:  how deep will be the pullback? The well spreaded "flash crash" or just one step back, before the next two steps ahead, which is typical for the bull market. 
4 hour to daily charts show overbought and diverging conditions. 
The current pullback's depth will be very important for the market to show us HIS choise: 
to resume the uptrend, unfolding 2,3,4,5 of (5)th wave short to med term, or deeper retrace  beyond 1173? 

Next support down is the previous top 1226.78. If broken 1219.74 April top and 38.2 Fibonacci level of the current 1st wave is the next support.
Upwards 1246.75 and 1263.15.
Daily close above 1247 will be important buy signal from the current point.
Good luck trading!