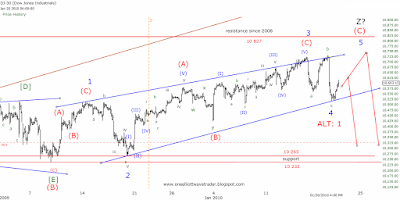
It was necessary to adjust my count a little these days ( short and long term). Downside decline still remains according to my count. The ending diagonal pattern has extended a little more, than I expected. The current uptrend from the mid-Dec 2009 low is losing momentum. However all attempts on the downside so far find solid support near the 10 232 chart level. Eventually though, breaking this level, will give way to a strong selling pressure to correct the entire rally from the July 2009 low.
Here my count shows, that one more little bounce up is expected. There is another alternative, that the end of that ED is already in place, and the expected decline is already on the way.

1 comment:
Hi,
My 2 cents. Best all
SPX - We're In A Secular Bear Market. 1040 Key Number
We're In A Secular Bear Market Like Japan.
Long term view - TOP 1150 -
If this is the Top and I believe it, when look this chart, we had last year a pullback of a BIG BEAR MARKET SECULAR. why??
Chart we have two indicators - EMA and RTS.
EMA if price close > EMA --> Bull Market
If price close < EMA --> Bearish
RTS give me confirmation Bull Market or Bear Mrket.
Beas until now neutral because price above EMA but RTS below yellow.
If price close montly below EMA change beas neutral long term to >> Bear Market.
If close this month below low of last month (1085.89) win momentum to test EMA 1040.
Chart here: http://3.bp.blogspot.com/_MJqKtyMMr28/S1rtWTHxeJI/AAAAAAAABes/FtzjXWm2Vbw/s1600-h/SPX+monthly+22012010.jpg
VIX - The End of the Beginning. Bears are back!
this is a 52% gain on the VIX (weekly). Wow! Bears are back!
Close this week above EMA200 (red) but below EMA55.
Need two consecutive closes above blue EMA (27.86)
will open door to visited 40 first target, possible extension to 45
Chart here: http://3.bp.blogspot.com/_MJqKtyMMr28/S1pPMimIpCI/AAAAAAAABek/iBqfAr8qE-E/s1600-h/vix+weekly+chart.jpg
DAX - Weekly - Top with two Bearish Signals
Dax have here a big problem. Bearish divergence with a new sell signal MACD. This is bad...very bad...
Can see last update Daily chart http://followmarketrend.blogspot.com/2010/01/dax-like-rocket-targets-around-corner.html
weekly chart here: http://4.bp.blogspot.com/_MJqKtyMMr28/S1o6BVriIxI/AAAAAAAABec/R9nv5tgkr0g/s1600-h/dax+weekly+21012010.png
ALERT Broke out of the channel, can started new downswing. Need confirmation close < 64300.
Below 64.300 ( daily close) expect 57.000 possible extension 55000.
Expect top between 69.700 and 72.180 (made that analysys at the end of 2009) >>>until now so far so good - High 71068 ** Click to zoom in. Cheers!!
http://3.bp.blogspot.com/_MJqKtyMMr28/S1t0BP9t_DI/AAAAAAAABe8/WegfmXV8hsU/s1600-h/bovespa++daily+22012010.jpg
Big trades for all.
Post a Comment