Dec 20, 2009

DJIA - update. Correction of the correction.

              I call "correction of the correction" all that rally since 6th of  March 2009 till now.
And now I have a few reasons to expect downside move, which is correction of the upper  "correction of the correction".
                                                 I think became too complicated.

  1. First one is a huge divergence to many indicators and price movement on daily base MACD,RSI, etc. 
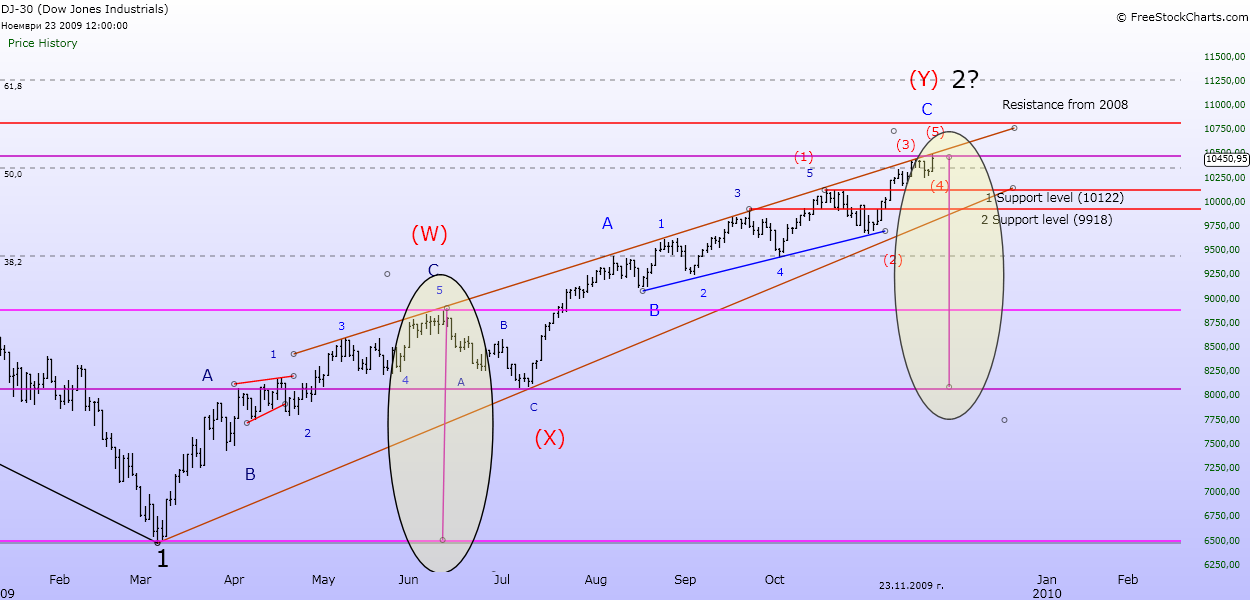
  2. All that straight rally hasn't got it's big enough correction  ( 06/11/2009-07/08/209)
  3.  The bulls advanced to 52.2% from 48.4% a week ago. That is the most long-term optimism we’ve seen since December 2007, when their number was retreating from 62.0% shown at that October’s all-time market high. A year later at the first bear market lows the bulls had slipped to just 22.2%.         Advisors Sentiment Table
    Date
    DJIA
    S&P 500
    Bullish
    Advisors %

    Bearish
    Advisors %

    Correction
    Advisors %

    Tue Dec 15, 2009
    10,501.05
    1,114.11
    52.20
    16.70
    31.10
    Tue Dec 8, 2009
    10,285.97
    1,091.94
    48.40
    16.50
    35.10
                  
  4. We are very close to end of  Fibonacci 3th cycle on the chart (orange dotted vertical line)  
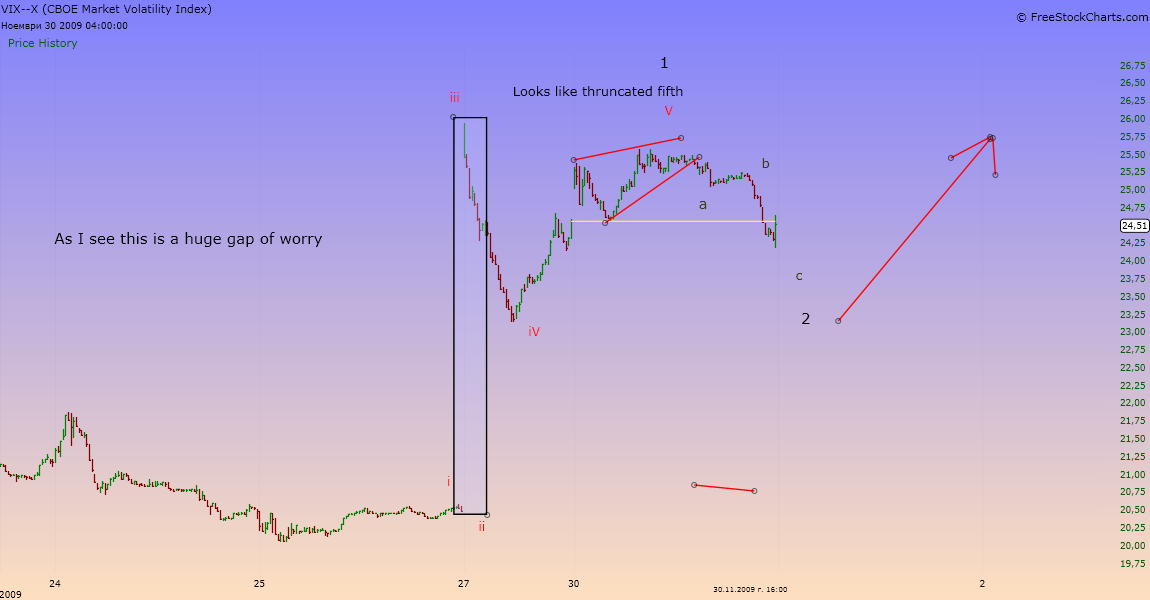
  5. I think we have 5 impulsive waves down.

                                                                       To many reasons.

Market preview


         Santa Rally might over, but the Grand Rally (since 6th of March 2009) might not yet .
        
         What do we need when the current picture is not impulsive and we are involved in counting waves and waves and waves,but corrective (till now) and unclear?
         We are looking for other instruments for help.
        
          As Elliott Wave Principle  followers, sometime we forget  the basic, and very well proved Charles Dow's theory. The Dow theory has been around for almost 100 years, yet even in today's volatile market, the basic components and patterns are still remain valid. The Dow theory, like the E.W. Theory  addresses not only technical analysis and price action, but also market philosophy.
      
        While I was previewing  few charts in daily base yesterday, a small lamp blinked over my head...(again)
I saw  it  in early August, but didn't pay it much attention.
         I've enclosed few charts; Just take a look at the first one - the main one.


 Isn't that the first one classical pattern we've learn about: Of course- HEAD AND SHOWLDERS.
As most of you know that's the formation, which has very high probability- about 90%,as much as in EWT.     


                                                                          One more chart:

 One more:


One more:


And one more:


 How do you think :
Don't they look like a big twin family?


Dec 18, 2009

DJIA - Santa Rally might over.


                It's majesty-the market make us all dump heads almost all the time.Now I feel like that, trying to predict next Dow move. My both charts review two different directions. I know that you have seen that movie (the price will go up or down), but the current tape is very unclear (for me).
                        That's why I released two counts.

               Firs one shows completed (5) wave, which is truncated after completed "expanded triangle", and marks the end of (Y) of double zig-zag.
The first leg down is underway and (V) of 1 is still incomplete. If the price breaks 10 235 key low will confirm that count.


               Second one shows (I) up after completed "expanded triangle  and very deep pull back as wave (II) as "zig-zag".
If the price breaks 10 235 low will eliminate this count.


I bet on the first chart.

Good luck !!!


Dec 14, 2009

DXY - USD Index - update


I think US Dollar's downtrend is already done for now.According to my EW count we have five clear waves downside  completed, which completes the A,B,C pattern - called "expanded flat".At the bottom the bulls were over 90 %. In my post - Nov 25th  i pointed  reversal area- about 74,17, and I was very close, it stuck at 74,23 and bounced up to make it's first wave up.A small correction is expected next few days, reaching 75,49 area, where is 50% Fibo retracement,  and then up again.


Good luck!

Dec 11, 2009

DJIA- Peak rally- short term

                                  
                                        Have we made a truncated top?, I still don' know .no,no.no

                 I am not really sure about that wave count until the opposite is proven by the price paintings.


I still wait for my fifth wave (5) to extend little higher to complete the pattern (W,X,Y) i have labeled. Also according to  Fobonacci time instrument, the reversal moment is very close, nearly 21-22 Dec.2009.
Interesting point of view comes from a colleague ewaver. Filipe Miguel has put all these, nearly 1 month SPX's squiggles in a frame,called "Diamond".The "diamond" is  trend reversal  formation, which means that the price will drop down early next week, which is very possible too. He made very sharp forecast about EUR/USD last week.
 

Bubbles stories


           When someone says the financial bubble has burst, we all know what "burst" means: A decline in stocks, indexes and real estate. Yet a  few people realize that the "bubble" itself involves more than just asset values -- it also involves psychology. And it's really important to distinguish between assets and psychology, for this simple reason: the end of bubble asset values does not mean the end of bubble psychology.


           In fact, mini-bubbles can happen after the big bubble has burst.


           Depending on how big the big bubble was, it can take a long time and a lot of losses to extinguish the psychology that drove it. It's easy to understand if you think about it. If things are not so good now, and better times are in the past, it won't take much to get the old enthusiasm going.


           Too much enthusiasm based on too little evidence is common to all bubbles, big or small. So here's where it gets tangible.
           Gold prices have recently pushed to all-time highs, the Dow Industrials to a new yearly high. But gold and the Dow have done this alone, as in NO other equity indices or commodities have followed.


           Now  which markets get all attention in the media? Gold and the Dow, of course -- to the point that people think the performance of these two markets is not the exception but the rule.


          Too much enthusiasm, too little evidence.


                                                                Enjoy the cartoons.


This is not a cartoon :)


Dec 9, 2009

DJIA - update


                                                           The triangle pattern looks completed.
                                             Get ready for the X-mas rally until something goes wrong :)


Good luck!

DJIA - update (last call for the bulls)

                                                     
                                             Hello wavers,
             I've got an important info to share with you today.


            According to Investors intelligence advisors sentiment, this week’s data included a new twelve year high for the advisors projecting a correction, along with lower readings for both the bulls and the bears. As things stand, the indexes continue to bet with 2009 highs. Pullbacks last week was brief and followed quickly by new buying. However, I have noted a narrowing of the participation.
        
            The bulls were down slightly to 50.0% after last week’s 50.6% reading, which equaled their September high. Both are still up nicely from the start of November, when a market pullback saw their drop to 44.4%. The advisors continue to show a major sentiment shift from a year ago when the bulls were just 22.2%. That was almost a twenty-year low going back to 15-Nov-88 when the bulls were 21.1%.The bears have left very fewThey were just 16.7%down from 17.6% the previous week and 26.7% the first week of November. That is the least bears since 13-Jun-03 when we counted them at 16.1%.
             
            The long-term bears are at their lowest level in over six years, while the short-term bears (those for a correction) are at their highest level in over twelve years - a very unusual pattern, according to them. The bulls are also well below where they were at the market peak in October 2007. This shows there are not a lot of bulls out there. But there are also many advisors who would like to become bulls if the market pulls back. As the markets often confounds expectations, I could see a year-end rally to new highs that could force the correction camp to capitulate and buy on strength. That, I think, could mark the top.
             
            The difference between the bulls and bears was 33.3%, up just 0.3% from last week and another bearish reading. Remember that last time we had such a large negative difference was in late 2007, just after the all-time high in the DJIA, pushing the  spread over 40%.


Date
DJIA
S&P 500
Bullish
Advisors %
Bearish
Advisors %
Correction
Advisors %
Tue Dec 8, 2009
10,390.11
1,103.25
48.40
16.50
35.10
Tue Dec 1, 2009
10,471.58
1,108.86
50.00
16.70
33.30
Tue Nov 24, 2009
10,433.71
1,105.65
50.60
17.60
31.80
Tue Nov 17, 2009
10,437.42
1,110.32
46.10
21.30
32.60
Tue Nov 10, 2009
10,246.97
1,093.01
44.40
26.70
28.90


My expectations are for higher prices after completing the "triangle pattern".

My longer term count :


Good trading to all.

Dec 8, 2009

DJIA - update


                                                            I still support my preferred count.


Good luck

Dec 6, 2009

DJIA - update

Hi wavers,
   I can offer two count :
   First one is preferred  
 As i can see, the market price moves in sideways wider & wider, and seem to form an "expanding triangle".
But the price needs to go little higher for (B)of the last [E] to deeper Fibonacci level 61.8%, and then dropping down to complete  the pattern with [E] wave of a triangle .If that happened i will expect rally up for  higher highs to complete (Y) wave of larger degree, which is not shown here.


My alternative count shows an "expanding flat" formation, which is completed.
I have labeled  1 wave up, which is completed as well. 2nd wave has formed an "expanding flat" and now higher wave 3 of (5) is expected to be formed.

These are the most well fitted possibilities I see.There are few more, but seem very complicated .


I still support that count of the bigger picture(daily)
.According to that labeling (5)th wave of a (Y) wave of double "zig-zag" doesn't look finished.The proportions are already 1:1(Y=W) by size, but i still wait for little more higher to complete the pattern.I expect 
that to occur around December 21-22nd  2009.   

Good luck!!!


Nov 30, 2009

No title


Bull & bear gambling.............


Gold is still shining...............


Ben promises prosperity............


And market rumor is going on.......as usual....

.

World ends in 2012? by Matheis, Shelley


Nov 27, 2009

STOXX50 - Head & Shoulders formation


Like in the textbooks.Even my both children could recognize such a clear pattern (H&S)of the conventional technical analysis. About the waves, i did not pointed them, because i want to see the prise movement during todays session and maybe in the weekend i will make it.


The bigger picture calls for short.There are few signs according to Dow theory.Broken trend line, lower bottom and lower top, but I still doubt about long term shorts, because (Y) wave has not 100% of (W) wave's size.That is around 3.043.
Have a look.


Good luck!

Nov 26, 2009

DJIA & GOLD

            When someone says the financial bubble has burst, we all know what "burst" means: A decline in stocks, indexes and real estate. Yet a few people realize that the "bubble" itself involves more than just asset values -- it also involves psychology. And it's really important to distinguish between assets and psychology, for this simple reason: the end of bubble asset values does not mean the end of bubble psychology.


In fact, mini-bubbles can happen after the big bubble has burst.


              Depending on how big the big bubble was, it can take a long time and a lot of losses to extinguish the psychology that drove it. It's easy to understand if you think about it. If things are not so good now, and better times are in the past, it won't take much to get the old enthusiasm going.


            Too much enthusiasm based on too little evidence is common to all bubbles, big or small. So here's where it gets tangible.
Gold prices have recently pushed to all-time highs, the Dow Industrials to a new yearly high. But gold and the Dow have done this alone, as in NO other equity indices or commodities have followed.


              Now which markets get all attention in the media? Gold and the Dow, of course -- to the point that people think the performance of these two markets is not the exception but the rule.


               Too much enthusiasm, too little evidence.


                                                              I attach an example chart.


Nov 25, 2009

DXY - USD Index - Falling Ending Diagonal


Sorry, i didn't have time yesterday for more charts.
But US Dollar Index seem to form an "ending diagonal".
It is expected to reverse according to most of the technical theories.
Also the sentiment indicators are very bearish (over 90%).It means that very soon there will be no buyers.
I pointed one of the potential Pivot points which might be the key level for reversal.


Nov 24, 2009

DJIA - wave count


According to my count,  all short term bullish positioned traders should cover their positions.
I will cover my point of view  with some examples.
First one  shows my count, i changed at the last moment yesterday.


Second one hsows how low is the daily volume. If tomorrows sessions make similar or lower volume, we should expect dropping  down shortly.


The third chart shows us how the price has reached 50% of Fibonacci retracement of all downside move since October 2007.


On fourth  chart we see that wave (W) is equal to wave (Y) by size.


After all charts i can not confirm beginning of Primary wave 3, because i want to see more confirmations about it. But i think we have to expect short term bearish movement and want to see will  the support levels   resist i pointed. Later today i intend to post few more charts for European market probably , so be in touch.
Good luck!