MARKET FORECASTING, USING GANN'S ASTROLOGY METHODS, ELLIOTT'S WAVE PATTERNS AND FIBONACCI LEVELS
Jan 8, 2010
DXY-Elliott Wave update
I think US Dollar's downtrend is already done for now. According to my EW count we have five clear waves downside completed, which completes the A,B,C pattern - called "expanded flat" of larger degree (primary). At the bottom the bulls were over 90 %, which was one of the signs of trend reversal. Few weeks ago i pointed reversal area- about 74,17, and I was very close, it stuck at 74,23 and bounced up to make it's first impulsive wave up. Correction after the 1st wave is already on the way , reaching 76,58 area, will suite my ego. There is one of the Pivot points, which is right in the middle between 38.2% and 50.0% Fibo retracement. Still hasn't reached 38.2 % Fib.
Jan 5, 2010
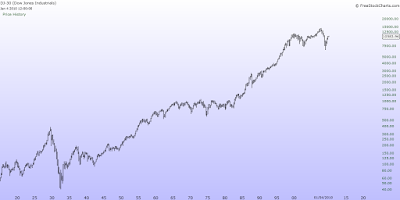
Exponential VS Log scale
We all live in an exponential world, and many of the market analyzers use that fact in their analysis.
The main problem comes from fact, that sometimes analyzers use linear, sometimes logarithmic graph.
You can't use log scale and make linear calculations, and the opposite.
Have a look at the both graphics bellow:

At first hand they look totally different, and have nothing common. More observant of you have already noticed
that on both is DJ 30.
Here is an interesting example:
Let's suppose that you have invested $1000 in General Electric for $8 per share in 1995, it makes 125 shares. For two years the price rises to $16 and you cover the long, taking $8 profit per share in the pocket, which makes 100% profit.
Few years later the price rises to $30, and you decide to buy your favorite instrument again. But this time you spend $1000 to buy only 33 shares. However, the price is going higher, reaching $60 in 2000. Then you decide to sell again, taking profit $30 per share, which is 100% profit again. Visually the spread between the blue lines is four times wider than the red ones. It's easy to make a mistake, that the second trade's profit is four times bigger. It is so, because the graphic is linear.
Here is the same GE logarithmic scale example:

I have calculated GE Fibonacci retracement levels of the move from $8 to $60 in both ways:
Fibo
|
50%
|
61.8%
| |
Linear
|
33
|
27.1
| |
Logarithmic
|
21.54
|
17.05
|
If we follow the linear calculating, could make a conclusion that GE's 61.8%Fibo retrace is nearly ($27.10) of its rising up, and as an ewavers using Fibonacci tool to expect bounce up again.
The picture is totally different, if we have calculated that correction in logarithmic way. It is obvious, that 61.8% of the correction is nearly $17, and there is more dropping down.
Which scale to use?
If we are daytraders, can use both, because the difference is very small.
If we are swing or longer term traders or investors- the linear one.
P.S. The price now differs , I just use an example graph.
Jan 4, 2010
Elliott Wave update
Sorry, no time for text part today.
Probably we'll see the valley from higher.
I changed the count a little.
Probably we'll see the valley from higher.
I changed the count a little.
Dec 31, 2009
Elliott Wave update
The picture looks almost the same as yesterday, no market makers left last few days, due to the holidays .The price seems to paint any kind of "flat" or "triangle" corrective pattern, which is typical for 4th waves. Little more optimism is needed about 5th wave to be finished. Probably it will occur first few days in 2010.
That is one of my counts, which shows almost completed complex correction(till now),only the (C) wave of Z looks unfinished.

That is other variant of my counting. According to this labeling the last wave of the W,X,Y pattern is not completed too.Very soon (early Jan.) the price will meet important resistance zone, where will be the battle between bulls & bears.

It doesn't matter which count is correct, the fact of bearish smell is all around in the air. I see many signs, that the market rally is running out of steam. It’s just a matter of time. Well, important tops are usually a process, not a one day event. Money first flows from more risky assets to more conservative. Then eventually it flees to bonds. And then it goes to cash equivalents. All that takes time. It doesn’t occur from one day to the next.
Some facts, supporting the bearish idea.
- According to AAII Sentiment Survey( American association of individual investors ), 11.5% have turned into bullish camp only for one week.
| Bullish | up 11.5 | ||
| Neutral | up 3.2 | ||
| Bearish | down 14.7 |
2. The price moves up, but volume is going lower last few sessions. This is based on individual investors naked optimism. More investors (speculators), less money.
3.Put/call ratio is going lower.
I don't have to reject next chart as well. I expect any dropping soon, but I do not believe that this cyclical bull move is done yet. As I said - it's a question of time.
Wish you Happy holidays, God bless you all !
And better trading in 2010 !
Subscribe to:
Posts (Atom)


